
FIGURE 14.
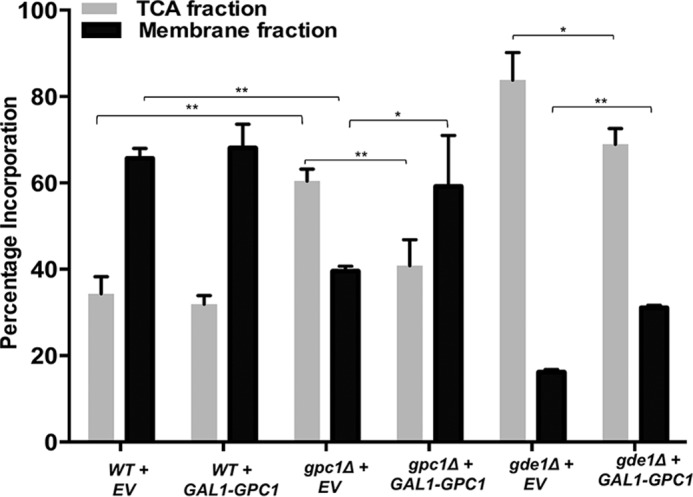
In vivo incorporation of [3H]GPC. The indicated strains were grown to logarithmic phase in galactose medium, and the distribution of the radioactivity between the TCA and membrane extracts was determined. Strains contained either EV or GPC1 under the control of the GAL1 promoter (GAL1-GPC1). Data represent the average of three independent cultures ± S.D. (error bars). A t test was performed to determine significance as indicated by brackets (*, p ≤ 0.05; **, p ≤ 0.0008).