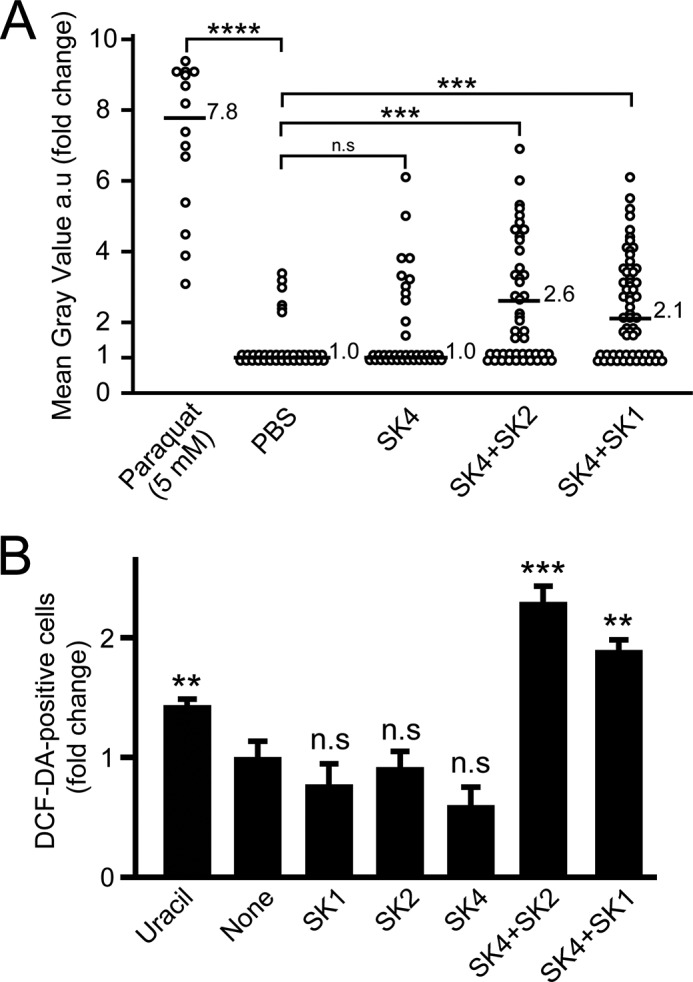
FIGURE 8.

ROS production in the midguts of gnotobiotic flies that mono- and co-ingested strains SK1–4. A, as a positive control for ROS production, flies ingested 5 mm paraquat. -Fold change in mean gray value of CellROX signal intensity in the anterior midgut was evaluated and normalized to the negative control (average signal intensity of negative control was set to 1). Horizontal bars, median -fold change for each ingestion group with the -fold change value. Ingestion groups were as follows: paraquat (n = 14); PBS (n = 36); SK4 (n = 38); SK4 + SK2 (n = 46); SK4 + SK1 (n = 61). Statistical analysis of the differences between the five ingestion groups was performed using the non-parametric Kruskal-Wallis test followed by the Bonferroni post hoc test. ***, p < 0.005; ****, p < 0.001; n.s, not significant. B, ROS production in S2 cells treated with microbial extracts. The -fold change of DCF-DA-positive cell number was analyzed (1,000 S2 cells in each group). The values shown are the means ± S.E. (error bars) (n = 3). p values were calculated by one-way ANOVA followed by the Bonferroni post hoc test. **, p < 0.01; ***, p < 0.005; n.s, not significant.
