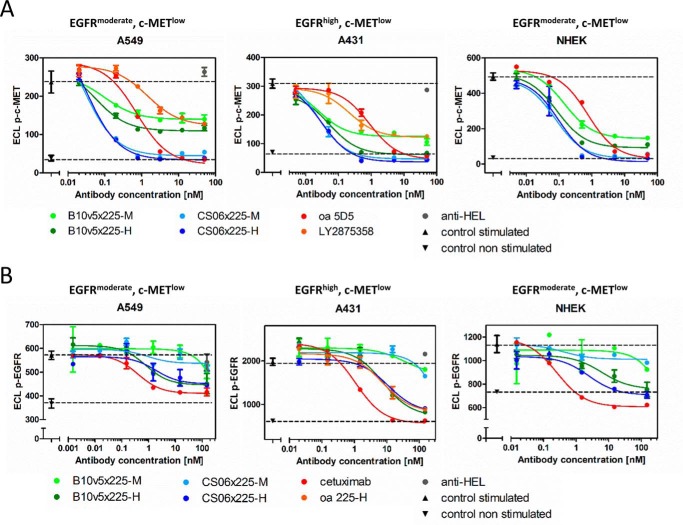
FIGURE 2.
Inhibition of c-MET and EGFR phosphorylation by EGFR × c-MET bsAbs during ligand stimulation. Phosphorylated c-MET (A) and phosphorylated EGFR (B) were quantified in A549, A431, and primary keratinocytes (NHEK) using ECL. Cells were treated with varying concentrations of bsAbs and a non-related isotype SEED control (anti-HEL) with subsequent stimulation with 100 ng/ml HGF (A) or 100 ng/ml EGF (B). Triangles and dotted lines indicate respective receptor phosphorylation levels for stimulated (upright triangle) and non-stimulated cells (inverted triangle). Dose-response curves were fitted using a 3PL model in GraphPad Prism version 5 (GraphPad Software). Error bars, S.D.

