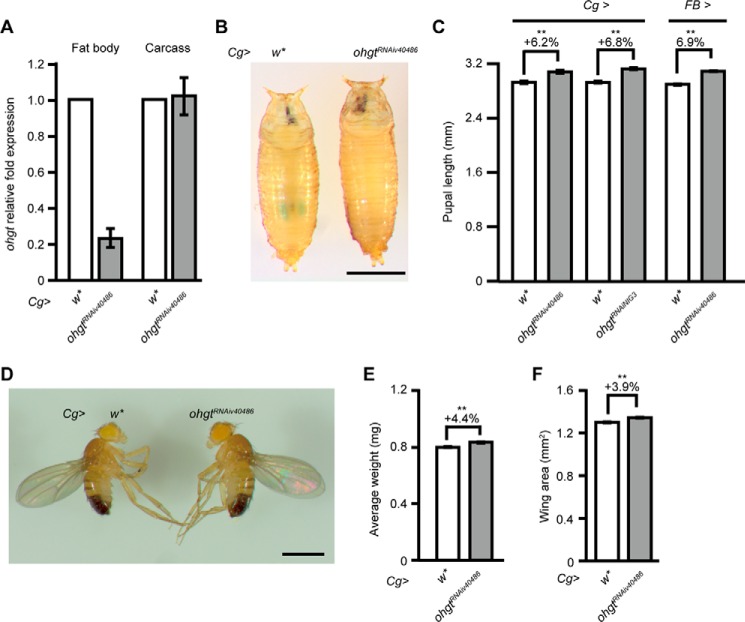
FIGURE 5.
Fat body-specific ohgt knockdown phenocopies the ohgt mutant phenotype. A, transcript levels of ohgt in the fat body and carcass of Cg>w* and Cg>ohgtRNAiv40486 third instar larvae were quantified using qRT-PCR (n = 4). B, Cg>w* and Cg>ohgtRNAiv40486 pupae. An animal whose length is closest to the average was chosen from each genotype. The scale bar represents 1 mm. C, average body length of Cg>w* (n = 48) versus Cg>ohgtRNAiv40486 (n = 66) pupae, Cg>w* (n = 40) versus Cg>ohgtRNAiNIG3 (n = 48) pupae, and FB>w* (n = 48) versus FB>ohgtRNAiv40486 (n = 52) pupae. D, Cg>w* and Cg>ohgtRNAiv40486 adult male flies. The scale bar represents 1 mm. E, average wet weight of Cg>w* and Cg>ohgtRNAiv40486 adult male flies. Animals were weighed in batches of 10, and average weight per animal was calculated (n = 8). F, average wing area of Cg>w* and Cg>ohgtRNAiv40486 adult males (n = 20). Error bars indicate S.E. * indicates p < 0.05, and ** indicates p < 0.01. Each p value was calculated by Student's t test. n.s. indicates no significance.

