FIGURE 10.
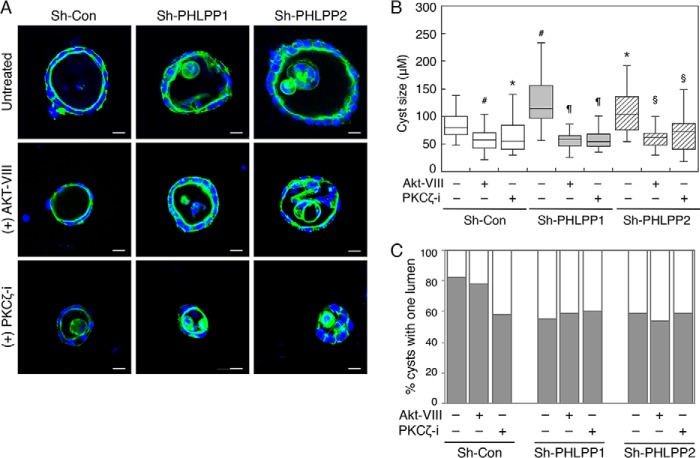
Inhibition of Akt does not affect cell polarity. A, stable sh-Con, sh-PHLPP1, and sh-PHLPP2 Caco2 cells seeded in 3D matrix as a single cell suspension. At day 7, the cells were left untreated or treated with Akt-VIII (0.5 μm) or PKCζ inhibitor (PKCζ-i, 20 μm) for an additional 7 days. The cells were subsequently fixed and stained with Alexa Fluor 488-conjugated phalloidin (green) and DAPI (blue). Scale bars, 10 μm. B, the sizes of 50 randomly chosen cysts as shown in A were measured using the Nikon Elements AR software. The size distribution is shown in the box-whisker plot. The average cyst sizes for the following cells are (means ± S.E., in μm): sh-Con, 84.2 ± 4.7; sh-Con+Akt-VIII, 59.6 ± 4.0; sh-Con+PKCζ-i, 61.7 ± 4.8; sh-PHLPP1, 122.1 ± 7.2; sh-PHLPP1+Akt-VIII, 55.7 ± 2.6; sh-PHLPP1+PKCζ-i, 59.1 ± 3.2; sh-PHLPP2, 108.2 ± 6.7; sh-PHLPP2+Akt-VIII, 59.3 ± 3.2; and sh-PHLPP1+PKCζ-i, 73.1 ± 6.5 (# indicates p < 0.001 and * indicates p < 0.01 when compared with untreated sh-Con cells, ¶ indicates p < 0.001 when compared with untreated sh-PHLPP1 cells, and § indicates p < 0.001 when compared with untreated sh-PHLPP2 cells by Student's t test). C, the percentages of cysts with a single lumen were quantified based on the pattern of actin staining and expressed graphically. Fifty randomly chosen cysts from each group were scored. The shaded bars represent cysts with one lumen, and the open bars represent cysts with multiple or filled lumens.

