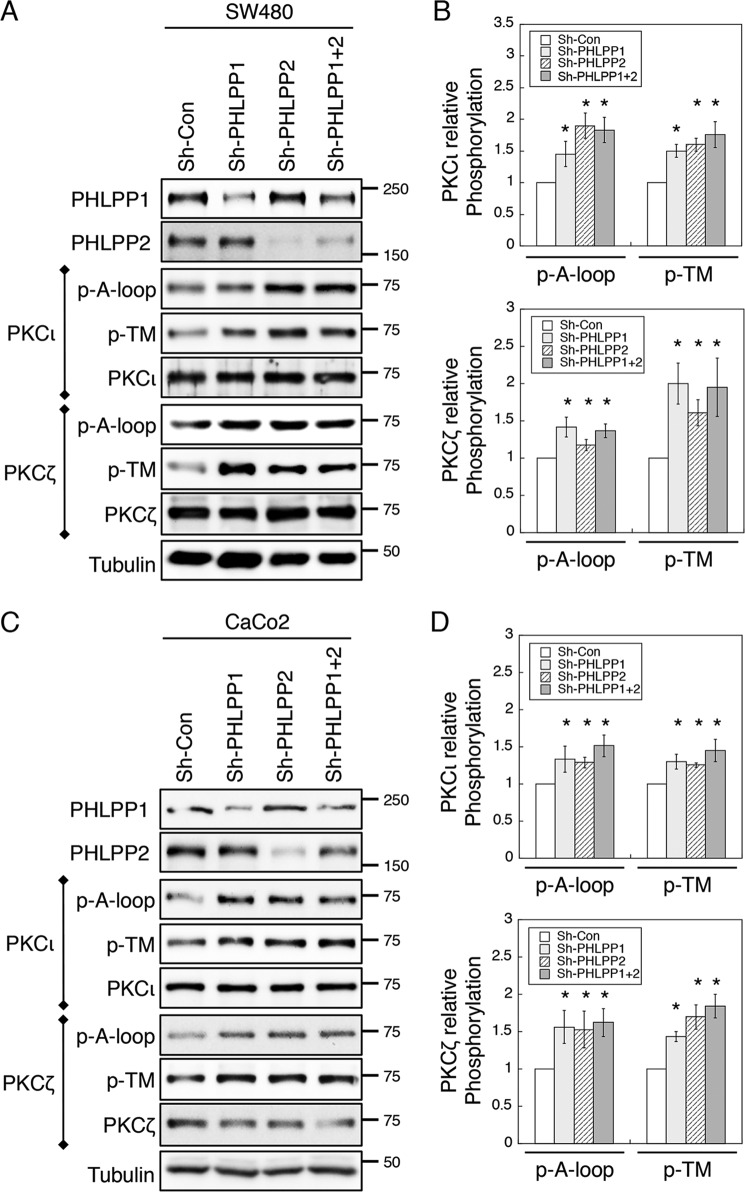
FIGURE 4.
Knockdown of PHLPP increases aPKC phosphorylation. A and B, cell lysates prepared from stable sh-Con, sh-PHLPP1, sh-PHLPP2, and sh-PHLPP1+2 SW480 (A) and Caco2 (B) cells were immunoprecipitated with PKCι- or PKCζ-specific antibody as indicated and subsequently analyzed for the phosphorylation (p) status at the A-loop and TM sites. C, and D, the relative phosphorylation levels of PKCι and PKCζ in SW480 and Caco2 cells, respectively. The relative phosphorylation of PKCι and PKCζ at the A-loop and TM sites was quantified by normalizing the ECL signals generated by the phospho-specific antibodies to that of total protein. Data shown in the graphs represent the means ± S.E. (n = 3, * indicates p < 0.05 by Student's t test when compared with sh-Con cells).

