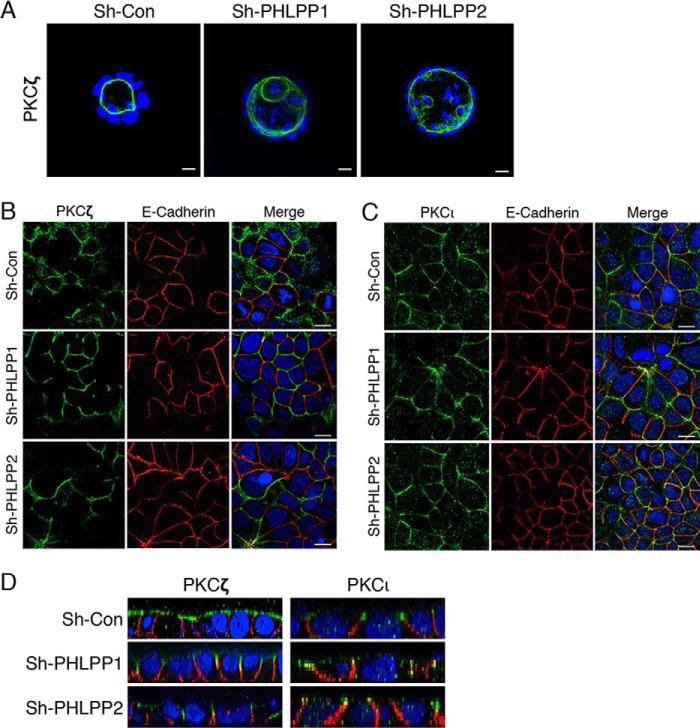
FIGURE 7.
PHLPP controls PKCζ localization in Caco2 cells. A, stable sh-Con, sh-PHLPP1, and sh-PHLPP2 Caco2 cells seeded in 3D matrix as a single cell suspension and allowed to grow for 14 days. The cells were fixed and stained with the PKCζ antibody (green) and DAPI. Representative confocal images show the localization of PKCζ in the cyst-like structure. Scale bar, 20 μm. B and C, stable sh-Con, sh-PHLPP1, and sh-PHLPP2 Caco2 cells were co-stained with antibodies against PKCζ or PKCι (green) and E-cadherin (red). Nuclei were stained with DAPI (blue). The merged images are shown. Confocal images were obtained using an Olympus FluoView FV1000 confocal laser scanning microscope with 60× objective. Scale bars, 20 μm. Note that the non-overlapping staining of aPKCs and E-cadherin indicates that aPKCs are localized to different membrane domains along the cell-cell junction when compared with E-cadherin. D, confocal xz images of PKCζ or PKCι (green), E-cadherin (red), and nuclei (blue) were generated from merged xy images of control and PHLPP knockdown Caco2 cells co-stained for these proteins.

