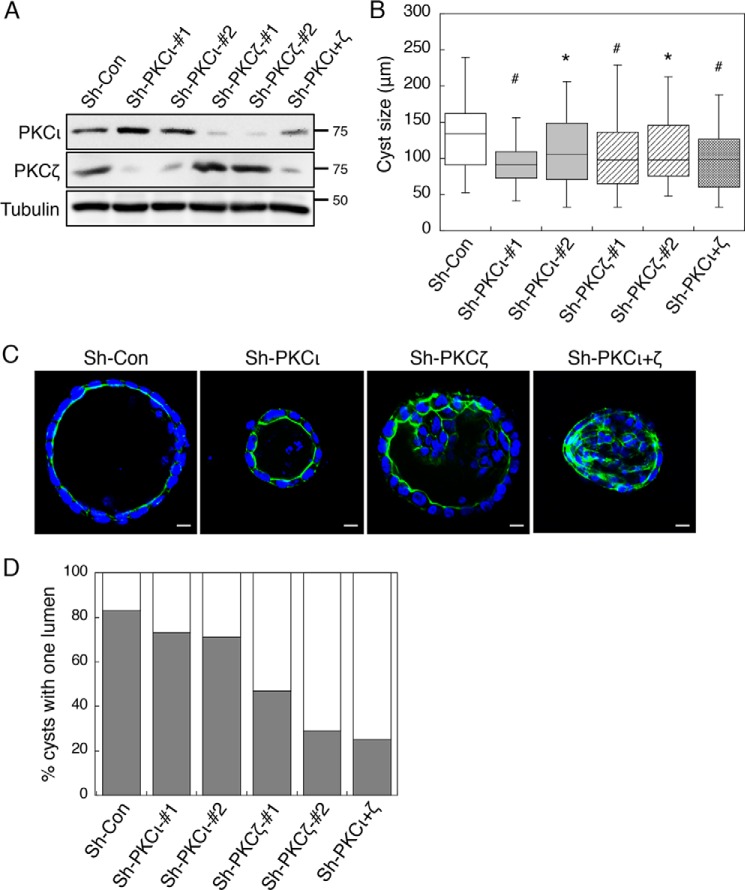
FIGURE 9.
Knockdown of PKCζ but not PKCι disrupts apical-basolateral polarity in Caco2 cells grown in three dimensions. A, stable control (sh-Con) and aPKC knockdown Caco2 cells were analyzed for the expression of PKCι and PKCζ by Western blotting. Two different targeting shRNAs were used to silence each aPKC isoform. B, the sizes of 50 randomly chosen cysts formed by the control and aPKC knockdown cells were measured using the Nikon Elements AR software and are shown in the box-whisker plot. The average cyst sizes for the following cells are (means ± S.E., in μm): sh-Con, 134.5 ± 6.8; sh-PKCι#1, 100.0 ± 5.8; sh-PKCι#2, 110.4 ± 6.9; sh-PKCζ#1, 101.1 ± 6.6; sh-PKCζ#2, 114.6 ± 7.8; and sh-PKCι+ζ, 104.7 ± 7.7 (* indicates p < 0.05 and # indicates p < 0.001 by Student's t test when compared with sh-Con cells). C, the lumen structure of the cysts formed by the control and aPKC knockdown cells. The cells were stained with Alexa Fluor 488-conjugated phalloidin (green) and DAPI (blue). Scale bars, 10 μm. D, the percentages of control and aPKC knockdown cells with a single lumen were quantified based on the pattern of actin staining and expressed graphically. Fifty randomly chosen cysts were scored. The shaded bars represent cysts with one lumen, and the open bars represent cysts with multiple or filled lumens.

