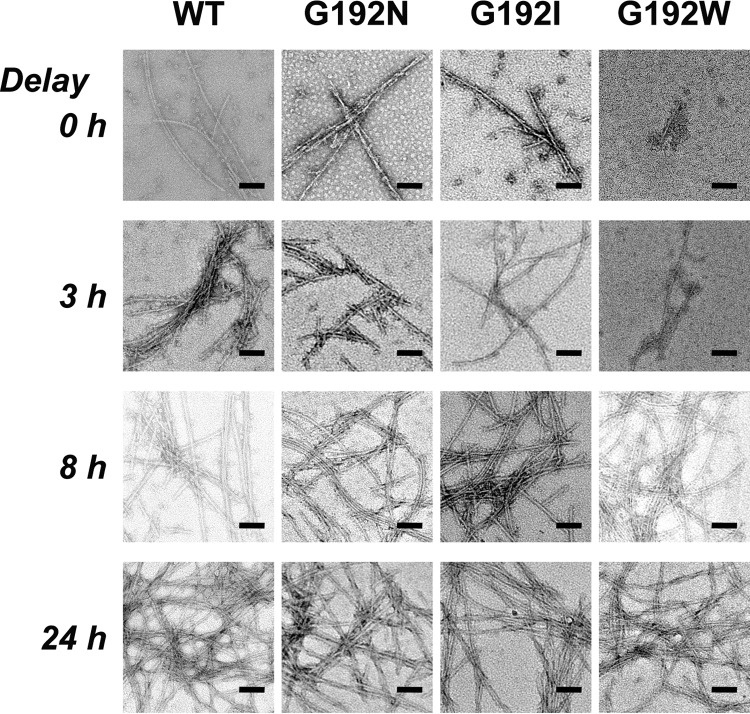
FIGURE 10.
TEM images of αSyn fibril samples that were recovered after the experiments shown in Fig. 9. Images are grouped vertically according to the type of GroEL added. The top row indicates αSyn fibrils that formed in the presence of GroEL without delay time (0 h), and subsequent lower rows show samples from reactions that were initiated in buffer, with GroEL added at progressively later intervals (3, 8, and 24 h). Scale bars indicate 100 nm.

