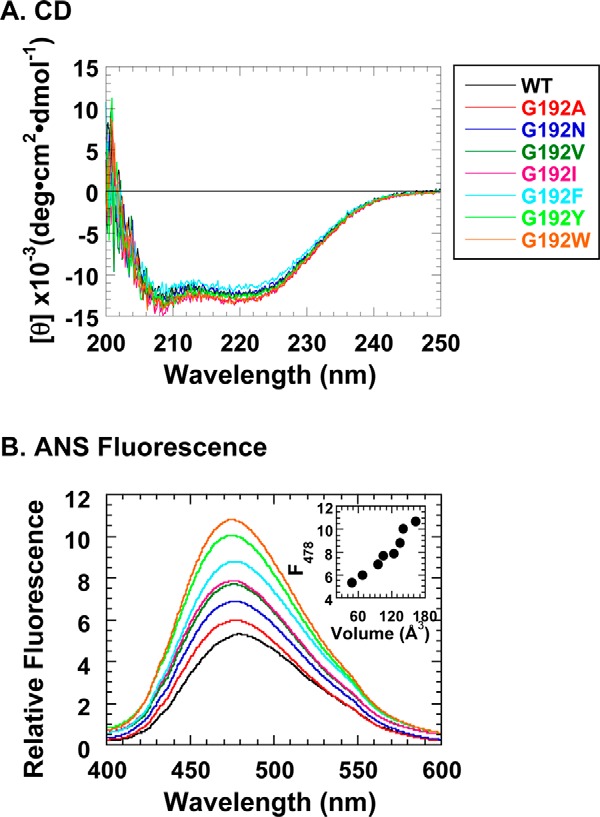
FIGURE 2.

Structural characterization of the seven GroEL G192X mutants. A, far-UV CD spectra of GroEL mutants. The color legend next to panel A denotes the data corresponding to each mutant, and this legend is valid, when applicable, for the data in each panel shown in Figs. 2–4. B, ANS fluorescence spectra of GroEL mutants to gauge surface hydrophobicity. The inset in B is a plot of the fluorescence intensity at 478 nm (F478) for each trace against the van der Waals volume of the amino acid side chains that replace Gly-192 in each mutant.
