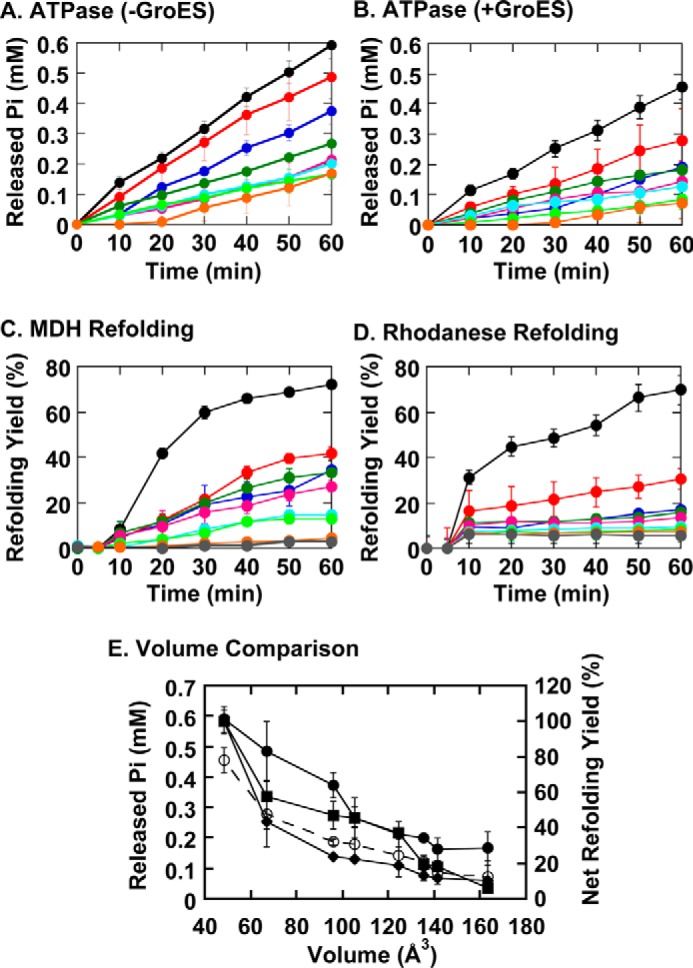
FIGURE 3.

Functional characterization of the seven GroEL G192X mutants. A, ATPase activities of the GroEL G192X mutants in the absence of GroES. B, ATPase activities of the GroEL G192X mutants in the presence of GroES. C, refolding assays of porcine MDH. D, refolding assays of bovine rhodanese. The gray traces in panels C and D denote spontaneous refolding reactions of each substrate protein performed in the absence of chaperonin. Refolding reactions in panels C and D were initiated in the absence of ATP, and 2 mm ATP was subsequently added at t = 5 min. E, functional characterizations of the G192X mutants summarized by plotting four distinct experimental values: the released inorganic phosphate concentrations detected at t = 60 min in panel A (closed circles: solid lines), similar values for panel B (open circles: dashed lines), and the net refolding yields at t = 60 min shown in panels C (closed squares) and D (closed diamonds), in a manner analogous to that shown in the inset to Fig. 2B. Error bars represent the S.E. of each data point.
