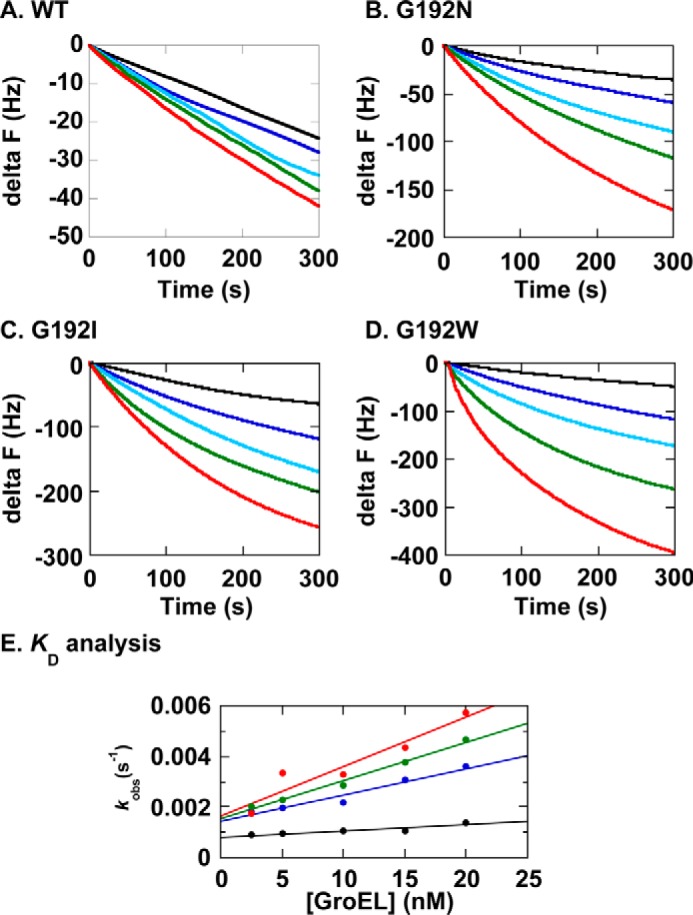
FIGURE 6.

Quantitative QCM binding analyses of GroEL WT and three G192X mutants to immobilized αSyn-His6. A–D, titrations of αSyn-His6 immobilized to the QCM sensor with increasing concentrations of GroEL WT (A), GroEL G192N (B), G192I (C), or G192W (D). Colors in each panel indicate QCM traces obtained by adding GroEL at the following concentrations: black, 2.5 nm; blue, 5 nm; cyan, 10 nm; green, 15 nm; red, 20 nm. E, estimation of KD values through linear regression fitting of [GroEL] versus kobs plots. Black, WT; blue, G192N; green, G192I; red, G192W.
