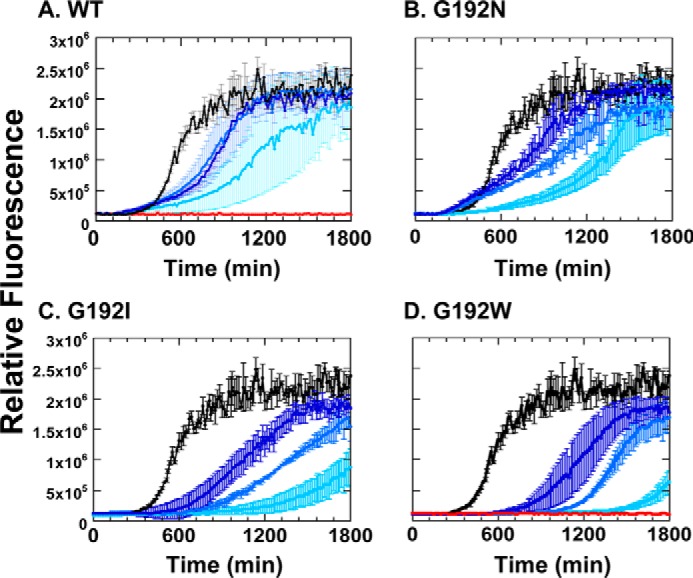
FIGURE 7.

Th-T fluorescence assays of αSyn fibrillation in the presence of GroEL WT and G192X mutants. A, GroEL WT. B, GroEL G192N. C, GroEL G192I. D, GroEL G192W. In each panel, lighter shades of blue are used to denote increasing concentrations of GroEL added to the experiment. Specific molar ratios of GroEL14 added to each sample relative to αSyn monomer are as follows: 0.05:1, 0.1:1, 0.2:1 (from dark blue to light blue). Red traces in panels A and D indicate Th-T fluorescence changes of GroEL WT and G192W incubated under identical conditions, respectively. Error bars represent the S.E. of each data point.
