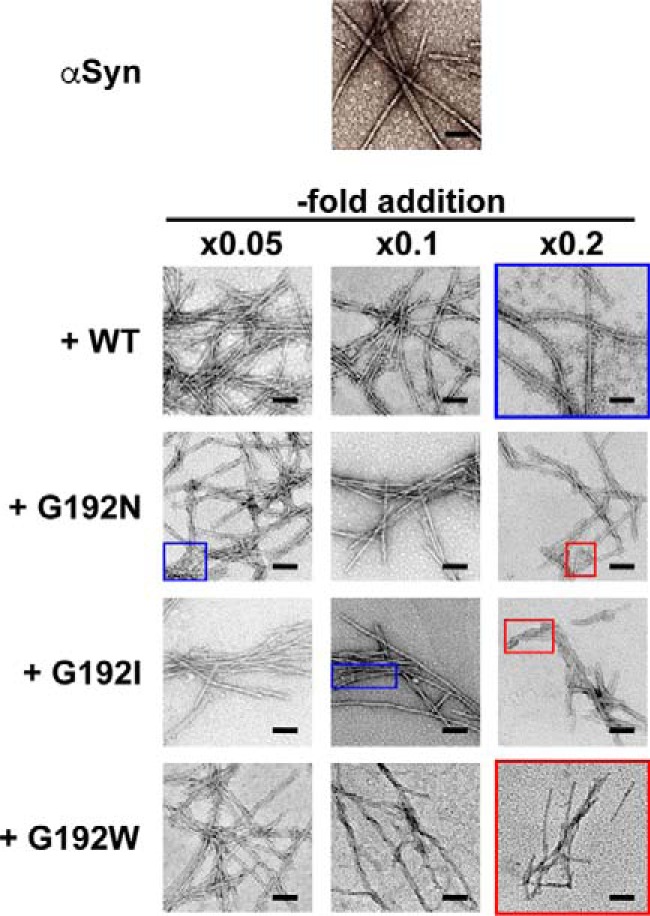
FIGURE 8.

Transmission electron micrographs of αSyn fibrils formed in Fig. 7 (at t = 30 h). Scale bars in each panel indicate 100 nm. The uppermost panel shows negatively stained samples of typical αSyn fibrils formed in the absence of chaperonin. The lower panels are grouped horizontally according to the type of chaperonin added to the αSyn fibril-forming reaction, and vertically according to the specific ratio of chaperonin oligomer added relative to αSyn monomer. Blue and red borders indicate grouping of panels and regions that show a common fibril morphology, as discussed in detail under “Results.”
