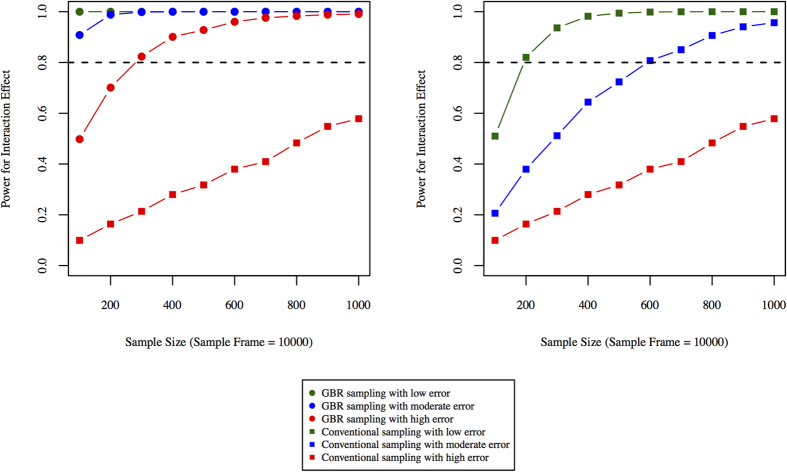
Figure 7.
Effect of measurement error on power: (A) shows power curves for phenotypes (outcomes) measure with varying degree of measurement error using the GBR paradigm, (B) shows power with different sample sizes using the conventional participant recruitment paradigm. Statistical power is plotted on the y-axis and samples sizes are plotted on x-axis.

