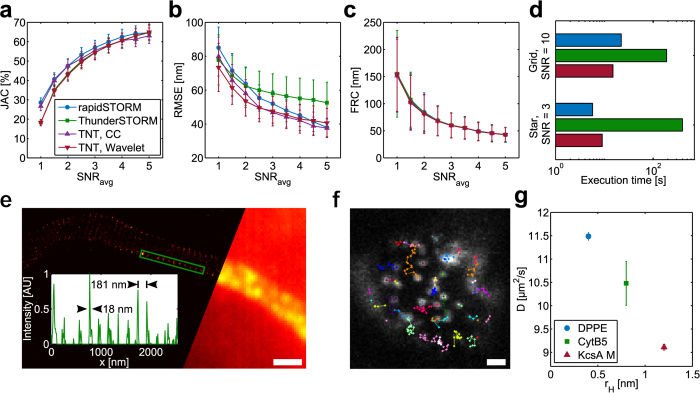
Figure 2. Simulation performance evaluation and experimental results.
(a–c) Overview of simulation results: Jaccard index, root-mean-square error, and Fourier ring correlation of emitters localized with different softwares at various average signal-to-noise ratio (SNR) levels. TrackNTrace is evaluated using both wavelet filtering and cross-correlation for emitter candidate detection. (d) Execution time of programs on Siemens star and high-SNR emitter grid data. (e) dSTORM imaging of a rat hippocampal neuron axon initial segment shows periodicity of βIV-spectrin in the cytoskeleton labeled with Alexa647. Inset: Normalized 1D intensity projection along the rectangle’s wide axis. (f) Example image of Atto655-labeled DPPE diffusing in a BLM. (g) Diffusion coefficients obtained for lipid bilayer experiments. Scale bar, 1 μm (e,f).

