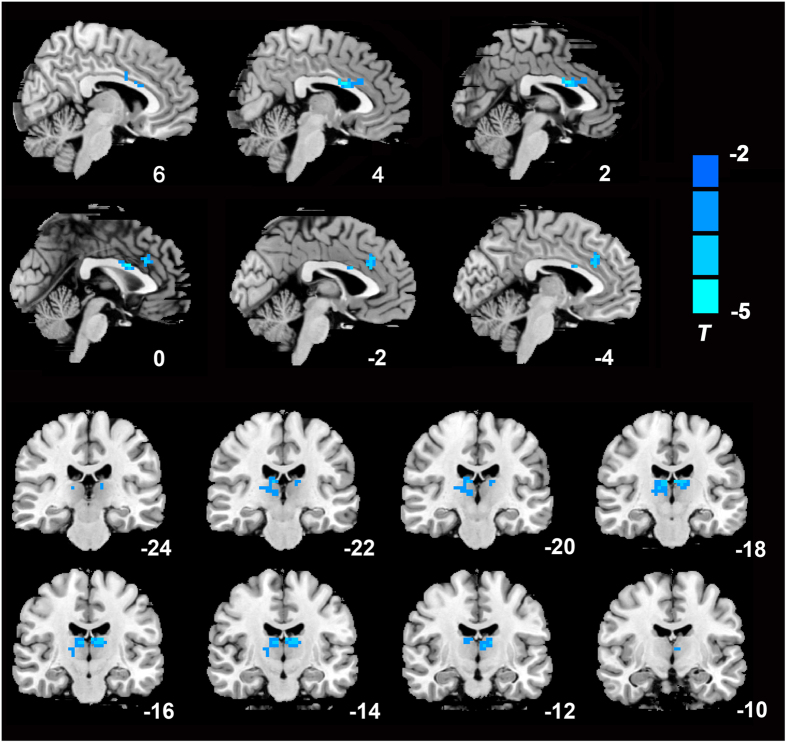
Figure 2. Significantly decreased functional connectivity maps of the default mode network in LOD patients.
AlphaSim correction based on Monte Carlo simulation algorithm was used to correct for multiple comparisons (single voxel P value = 0.01, FWHM = 6 mm, with 61 × 73 × 61 mm3 whole brain mask, which yielded a corrected threshold of P < 0.05, cluster sizes >1080 mm3). Clusters located in the dACC and thalamus were shown on the sagittal and coronal brain image respectively. The color bar indicates the T value from two-sample t-test. Left in the figure indicates right side of the brain.

