
Figure 2.
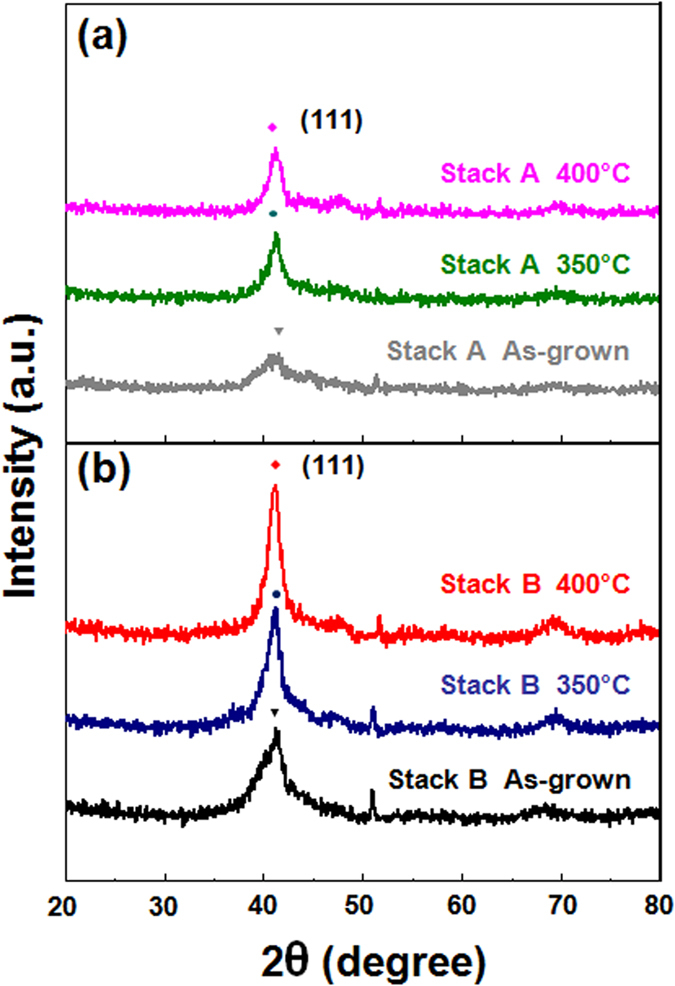
HR-XRD patterns of as-grown (grey, black lines), 350 °C post-annealed (blue, green lines) and 400 °C post-annealed (magenta, red lines) samples belonging to Stack A (a) and Stack B (b).
Official websites use .gov
A
.gov website belongs to an official
government organization in the United States.
Secure .gov websites use HTTPS
A lock (
) or https:// means you've safely
connected to the .gov website. Share sensitive
information only on official, secure websites.
HR-XRD patterns of as-grown (grey, black lines), 350 °C post-annealed (blue, green lines) and 400 °C post-annealed (magenta, red lines) samples belonging to Stack A (a) and Stack B (b).