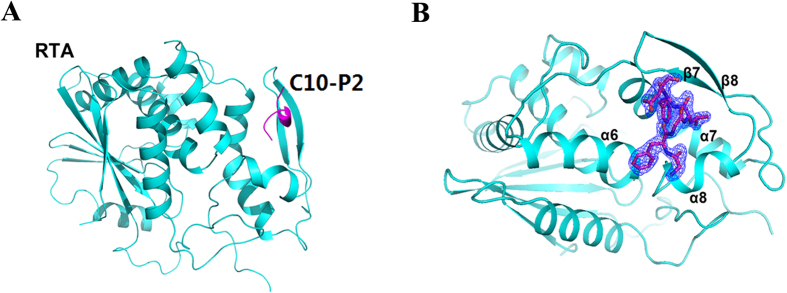
Figure 2. Overall structure of RTA in a complex with the C10-P2 peptide.
(A) A cartoon representation of the structure of RTA (cyan) in a complex with the C10-P2 peptide (magenta). (B) Details of the interaction between RTA and the C10-P2 peptide. The α6, α7, α8, β7 and β8 of RTA form a pocket that recognises the C-terminus of the C10-P2 peptide. Residues in the C-terminus of the C10-P2 peptide are shown as sticks. The 2Fo-Fc electron density map (contoured at 1σ) for the C10-P2 peptide is shown in blue.

