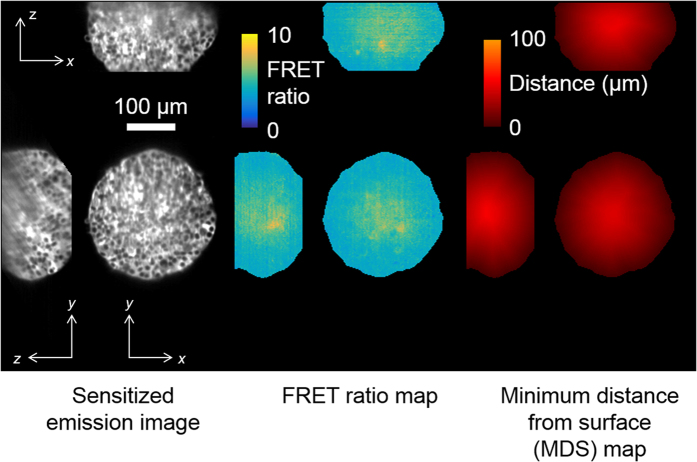
Figure 5. Left column, sensitised acceptor emission intensity for x-y, x-z and y-z slices through the centre of the HEK293T FLII12Pglu-700μδ6 spheroid imaged in well C5 of plate 1 at t = 174 min.
Middle column, corresponding FRET ratio map without intensity merging. Right column, calculated map of the minimum distance to the surface of the spheroid.

