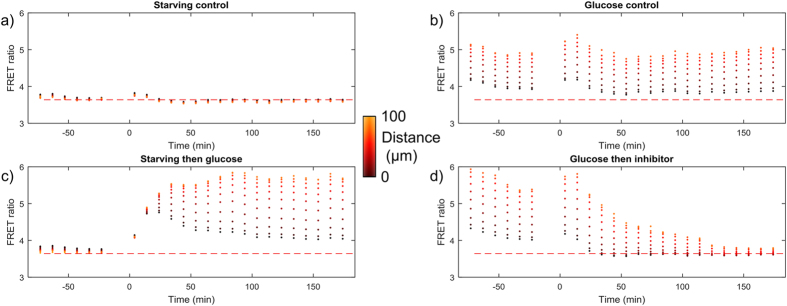
Figure 6. HEK293T FLII12Pglu-700μδ6 FRET ratio as a function of MDS averaged over all four spheroids for each condition.
(a) 0 mM extracellular glucose control, (b) 25 mM glucose control, (c) 0 mM glucose then 25 mM glucose and (d) 25 mM glucose then addition of 100 μM phloretin. The horizontal dashed red line shows the mean FRET ratio over all time-points for panel (a).

