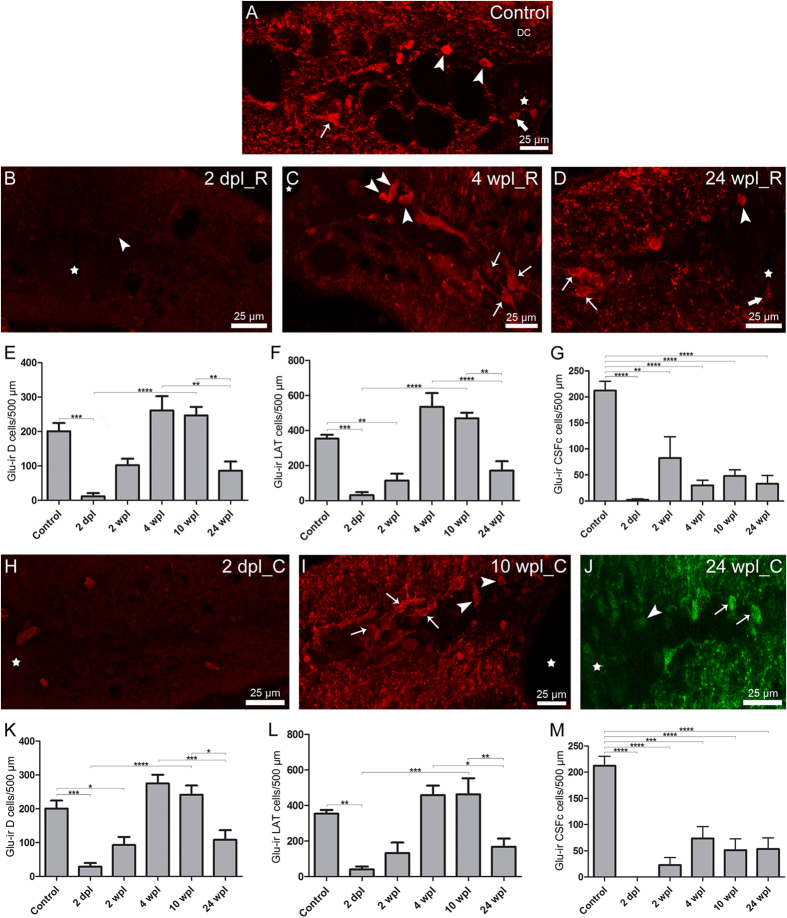
Figure 4. Long-term changes in glutamatergic cell numbers.
(A–D) Photomicrographs of transverse sections of the spinal cord, showing glutamate-ir cells in control larvae (A) and in the rostral (R) stump of 2 dpl (B), 4 wpl(C) and 24 wpl (D) larvae. Dorsal interneurons (arrowheads); lateral interneurons (arrows); CSFc cells (thick arrows); central canal (star). (E–G) Graphs showing the number of glutamate-ir dorsal interneurons (E), lateral interneurons (F) and CSFc cells (G) in the rostral stump of the spinal cord. (E) Control: 200.8 ± 23.6; 2 dpl: 11.4 ± 9.3; 2 wpl: 102.1 ± 18.9; 4 wpl: 260.9 ± 41.6; 10 wpl: 246.9 ± 24.6; 24 wpl: 86.3 ± 26.5. ANOVA, p < 0.0001. (F) Control: 353.4 ± 21.8; 2 dpl: 31.3 ± 16.8; 2 wpl: 115.3 ± 39.2; 4 wpl: 535.0 ± 78.9; 10 wpl: 469.9 ± 31.7; 24 wpl: 170.9 ± 53.9. ANOVA, p < 0.0001. (G) Control: 212.3 ± 17.7; 2 dpl: 2.0 ± 2.0; 2 wpl: 82.5 ± 40.9; 4 wpl: 29.9 ± 9.9; 10 wpl: 47.8 ± 11.8; 24 wpl: 32.8 ± 16.1. ANOVA, p < 0.0001. (H–J) Photomicrographs of transverse sections of the spinal cord, showing glutamate-ir cells in the caudal (C) stump of 2 dpl (H), 10 wpl (I) and 24 wpl (J) larvae. (K–M) Graphs showing the number of glutamate-ir dorsal interneurons (K), lateral interneurons (L) and CSFc cells (M) in the caudal stump of the spinal cord. (K) Control: 200.8 ± 23.6; 2 dpl: 29.3 ± 10.2; 2 wpl: 93.2 ± 23.7; 4 wpl: 274.9 ± 25.9; 10 wpl: 241.3 ± 27.8; 24 wpl: 108.7 ± 28.1. ANOVA, p < 0.0001. (L) Control: 353.4 ± 21.8; 2 dpl: 40.2 ± 16.9; 2 wpl: 132.8 ± 58.6; 4 wpl: 458.1 ± 54.3; 10 wpl: 463.1 ± 89.9; 24 wpl: 167.6 ± 45.9. ANOVA, p < 0.0001. (M) Control: 212.3 ± 17.7; 2 dpl: 0.0 ± 0.0; 2 wpl: 23.0 ± 14.1; 4 wpl: 73.7 ± 22.5; 10 wpl: 51.4 ± 21.7; 24 wpl: 53.2 ± 21.6. ANOVA, p < 0.0001. *0.01–0.05; **0.01–0.001; ***0.001–0.0001; **** < 0.0001.

