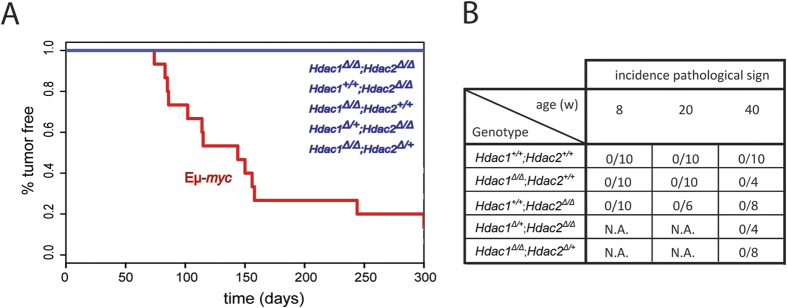
Figure 1. Hdac1 and Hdac2 have no tumor suppressor function in B cells.
(A) KPLM tumor-free survival curves for 15 age-matched mice are shown with indicated genotypes. Eμ-myc tg mice are shown as control. Mice were monitored over a period of 300 days for tumor onset and sacrificed when they reached termination criteria (see Material and Methods). (B) Table summarizing histopathological analysis from spleen and lymph nodes of Hdac1 and/or Hdac2 KO mice with indicated genotypes at 8, 20, and 40 weeks. n = 4–10 as indicated, N.A. for not analyzed.

