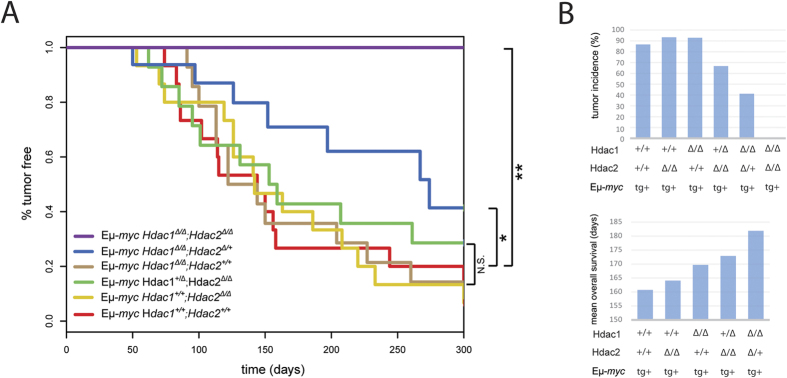
Figure 2. Eμ-myc tumorigenesis is Hdac1 and Hdac2 gene dose-dependent.
(A) Kaplan-Meier tumor-free survival curves are shown for 15 age-matched mice with indicated genotypes. The log-rank test was used to determine the level of significance between curves in the KPLM plots. Significant differences between genotypes are indicated, *p < 0.05; **p < 0.01. N.S., not statistically significant. (B) Tumor incidence (%; upper panel), and mean overall survival (days; lower panel), according to indicated Hdac1 and Hdac2 genotypes. Bar plots show values extracted from panel A.

