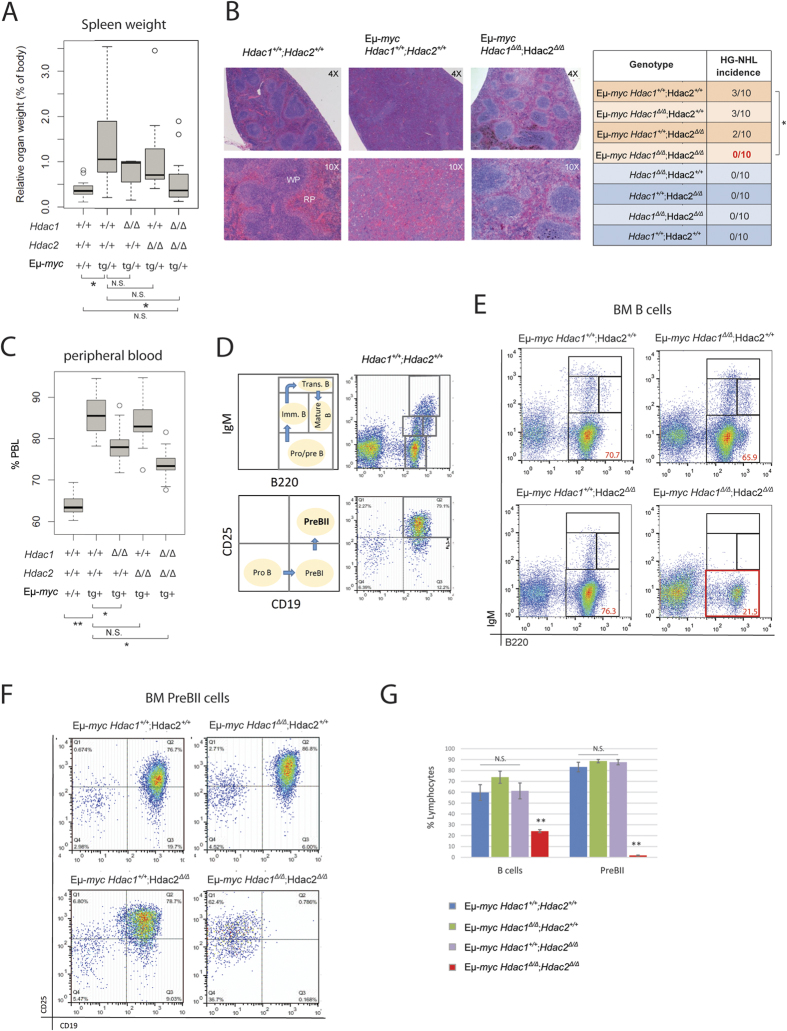
Figure 3. Complete Hdac1 and Hdac2 ablation prevents Eμ-myc tumorigenesis.
All experiments were performed in 8-week-old mice. (A) Boxplot shows relative spleen weight (% of body weight) of mice with indicated genotypes. p-values were generated using Wilcoxon Signed-Rank Test (n = 11). (B) Representative pictures from histopathological analysis of hematoxylin and eosin stained spleen sections of Eμ-myc mice with indicated genotypes and healthy Hdac1+/+; Hdac2+/+ control. Original magnification of 4X and 10X as indicated (left panel). Pathological findings of HG-NHL were scored in spleen and lymph nodes and summarized (table, right panel, n = 10). p-value was calculated using Student unpaired 2-tailed t test. (C) Blood analysis with automated blood analyzer. Percentage (%) of PBL of indicated genotypes (n ≥ 10). p-value calculated with Wilcoxon Signed-Rank Test. (D–F) Eμ-myc BM cells from mice with indicated genotypes were stained with B cell surface marker-specific antibodies, including B220, IgM, CD19 and CD25, and analyzed by flow cytometry. (D) Schematic representation of wild-type BM profile: B220/IgM to distinguish between Pro/preB (B220+; IgM−), immatureB (B220low; IgM+), transitional B (B220+; IgM+) and mature B (B220high; IgM+) cells (upper panels). CD19/CD25 to identify PreBII cell subset (B220+;CD19+; CD25+; lover panels). (E) Representative flow cytometry dot plots of B220/IgM staining gated on total BM lymphocytes. Gated regions indicate B cell subsets of interest with frequency in percent. (F) Representative flow cytometry dot plots showing PreBII lymphocytes subsets. (G) Quantification of flow cytometry analysis from (E,F; n = 4–6 biological replicates). Average percentage of B cells (B220+) and PreBII cells represented with s.e.m. Statistical analysis was performed with Student unpaired 2-tailed t test. Significant differences in means between genotypes are indicated, *p < 0.05; **p < 0.01. N.S., not statistically significant.

