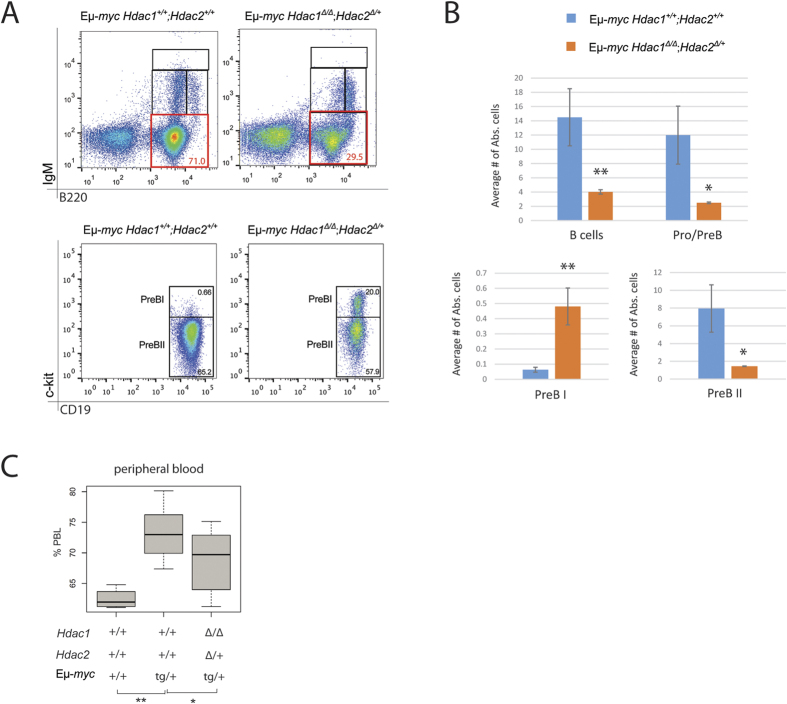
Figure 5. Hdac1Δ/Δ; Hdac2Δ/+ Eμ-myc mice have delayed tumorigenesis.
All experiments were performed in 8-week-old lymphoma-free mice. (A,B) BM cells obtained from 8-week old Eμ-myc mice with indicated genotypes were stained with B cell surface marker-specific antibodies, including B220, IgM, CD19 and c-kit, and analyzed by flow cytometry (representative dot plots are shown). (A) Representative flow cytometry dot plots gated on total BM lymphocytes. Gated regions indicate B cell subsets of interest with frequency in percent. Pro/preB cell subset (B220+; IgM−) is indicated (red gate, upper panels). Gated PreBI (B220+; c-kit+; CD19+) and PreBII (B220+; CD19+; c-kit−) cell populations are indicated (lower panels). (B) Quantification of flow cytometry analysis with s.e.m. (n = 3 biological replicates). Average percentage of B cells (B220+) and Pro/PreB cells (upper plots), and PreBI and PreBII (lower plots). Statistical analysis was performed with Student unpaired 2-tailed t test. (C) Blood was analyzed with automated blood analyzer. Shown are box plots with frequency (%) of PBL from indicated genotypes (n = 10). p-value calculated with the Wilcoxon Signed-Rank Test. Significant differences are indicated, *p < 0.05; **p < 0.01. N.S., not statistically significant.

