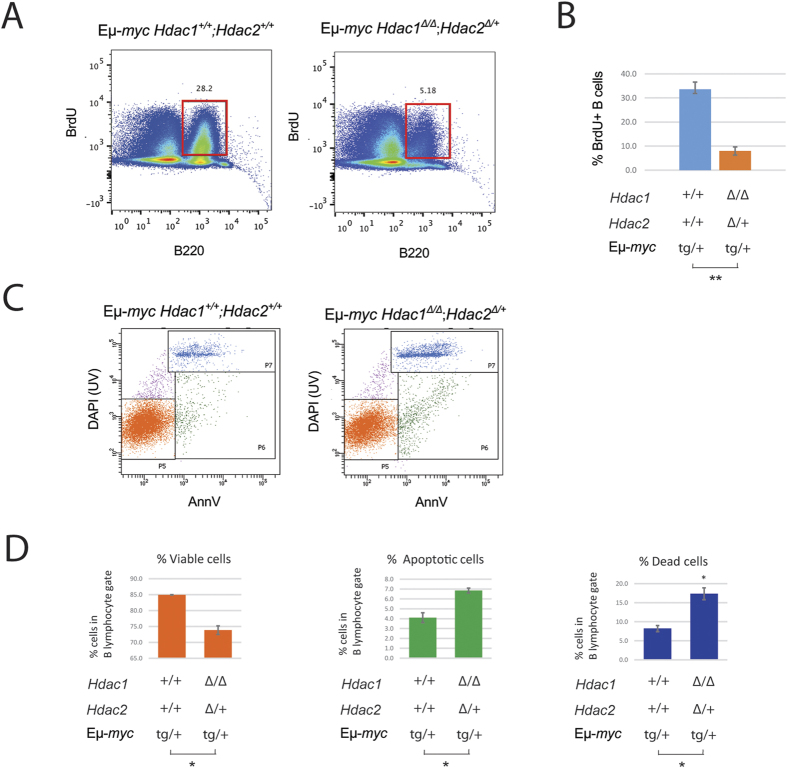
Figure 7. Hdac1Δ/Δ; Hdac2Δ/+ impact on proliferation and apoptosis.
Experiments were performed in 8-week-old lymphoma-free mice. (A,B) Proliferation analysis by flow cytometry from BM B cells of mice with indicated genotypes injected with BrdU. (A) Representative flow cytometry dot plots from indicated genotypes. Gated regions indicate B220+; BrdU+ cycling B cells with frequency in percent. (B) Quantification from flow cytometry analysis with mean and s.e.m. of BrdU-positive B cells is shown. (C,D) BM cells isolated from Hdac1+/+; Hdac2+/+ and Hdac1Δ/Δ; Hdac2Δ/+ Eμ-myc mice and stained with Annexin V, DAPI and B cell surface markers for flow cytometry analysis. (C) Representative flow cytometry dot plots from apoptosis assay: viable B cells (P5; annexinV− DAPI−), apoptotic B cells (P6; annexinV+ DAPI−) cells, and dead cells (P7; annexinV+ DAPI+). (D) Quantification of figure (C). Mean percentages and standard deviations are shown. All statistical analysis were performed with the Student unpaired 2-tailed t test. Significant differences in means between genotypes are indicated, *p < 0.05.

