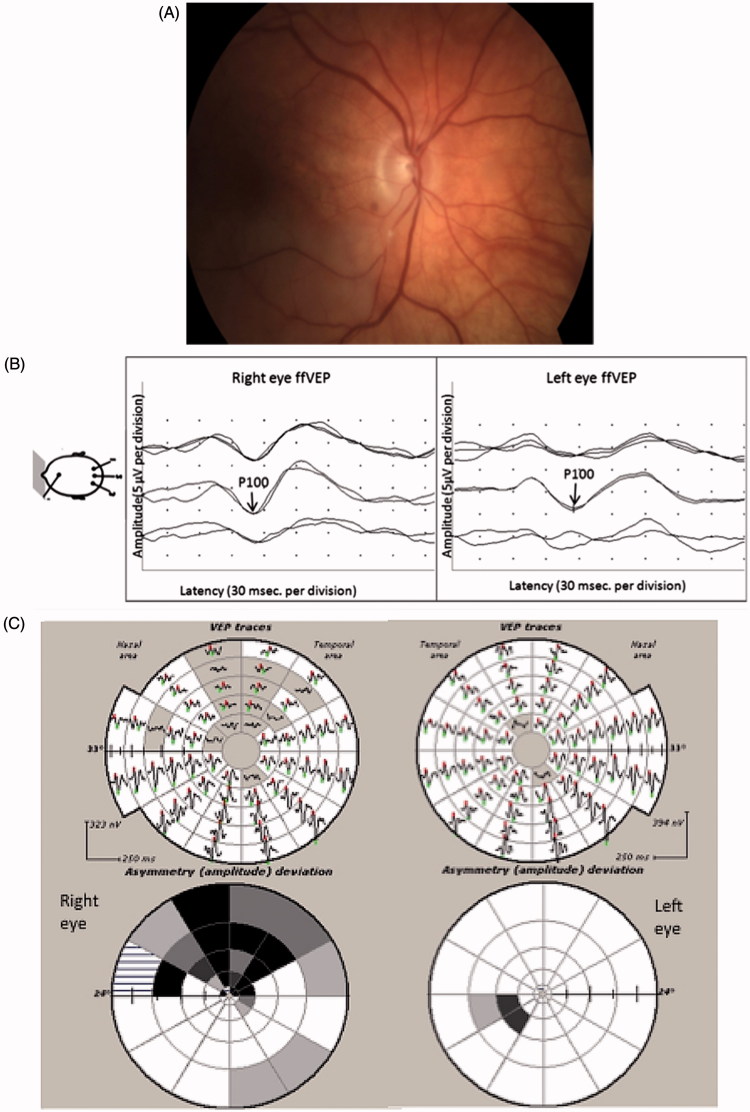
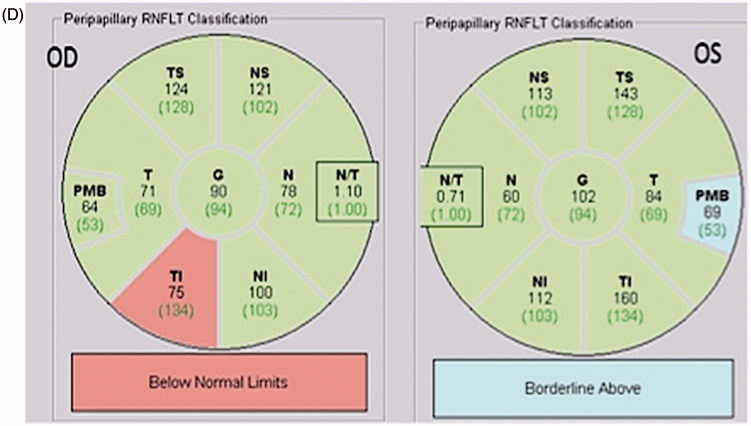
FIGURE 1.
(A) Fundus photography of the right eye showing an embolic inferotemporal branch retinal artery occlusion. (B) Full-field PVEP of the right and the left eyes showing normal amplitude and latency. The right eye PVEP has higher amplitude and better-defined waveform. (C) mfVEP showing reduction of amplitude in the upper field of the right eye. (D) OCT of the right eye showing an inferior RNFL thickness reduction.


