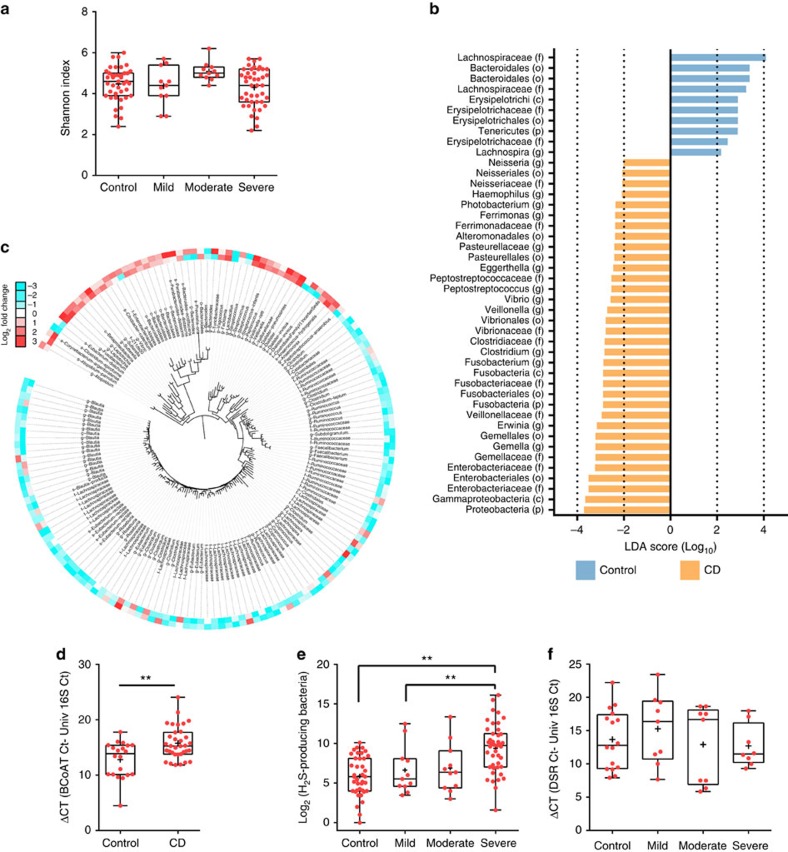
Figure 1. Assessment of the microbiota composition at the mucosa-luminal interface of new-onset paediatric IBD.
(a) Diversity of the intestinal microbiota in control and CD paediatric patients as a function of disease severity. Shannon index was calculated using 500,000 reads per sample. Crosses indicate the mean while horizontal lines indicate the median. (b) Histogram of linear discriminant analysis (LDA) effect size score for CD differentially abundant taxa compared with controls (n=65 and 42 for CD and controls, respectively); only OTUs meeting an LDA significant threshold ≥2 with a P<0.05 (pairwise Wilcoxon test) are shown and are denoted with their lowest defined taxonomy. (c) Phylogenetic tree of the differentially abundant OTUs identified by metagenomeSeq analysis (fold change ≥2 and P<0.05); an increasing red intensity indicates OTUs whose relative abundance increased, whereas an increasing blue intensity indicates OTUs whose relative abundance decreased in CD patients with severe inflammation as compared with mild (outer circle) or severe as compared with moderate (inner circle); the maximum colour output for this figure was set at a Log2 value of ±3. (d) The qPCR quantification of butyrate producing bacteria in control and CD microbiota. Butyryl-CoA: acetyl-CoA transferase gene (BCoAT); n=20 and 34 for control and CD, respectively; statistical comparison by Mann–Whitney two-tailed test; **P<0.01). (e) Log2 sum of rarefied reads assigned to taxa known to produce H2S through amino acid fermentation were plotted for the control and as a function of CD severity (n=39, 11, 11, 43 for control subjects and mild, moderate and severe CD, respectively). (f) The qPCR quantification of sulfate reducing bacteria in control and CD patient microbiota as a function of disease severity. Dissimilatory sulfide reductase gene (DSR); n=16, 9, 9 and 8 for control, mild, moderate and severe CD, respectively). (a,e,f) Statistical comparison by Kruskal–Wallis test using Dunn's post hoc test and followed by a Bonferroni correction for the significance level; *P<0.05; **P<0.01. Crosses indicate the mean while horizontal lines indicate the median.

