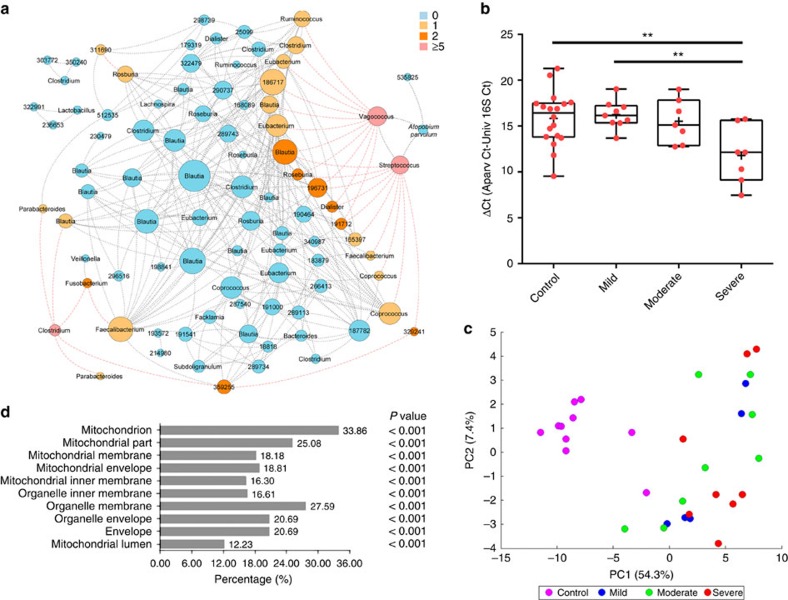
Figure 2. Enrichment of A. parvulum and altered mitochondrial proteome define the severity of Crohn's disease.
(a) Interaction network of differentially abundant OTUs; each node represents an OTU and are sized according to their number of interactions; each edge denotes a significant co-exclusion (red) or co-occurence (grey) relationship between OTUs. Nodes are coloured by their number of significant co-exclusions. (b) The qPCR quantification of A. parvulum in control and CD microbiota as a function of disease severity. ΔCt was calculated by subtracting average Ct values of universal 16S rDNA from average Ct values of A. parvulum specific primers (n=18 for controls, nine for mild CD and seven for moderate and severe CD). **P<0.01 estimated using Kruskal–Wallis followed by Dunn's post hoc test. Crosses indicate the mean while horizontal lines indicate the median. (c) Principal component analysis of the differentially expressed proteins among controls and CD patients categorized as a function of disease severity. (d) Functional annotation (cellular component) analysis of the differentially expressed proteins; the 10 most significantly enriched functional groups (GO terms) are shown (Fisher's exact test P<10−13). The illustrated P values are for classifications that were significantly enriched compared to the whole proteomic data set.

