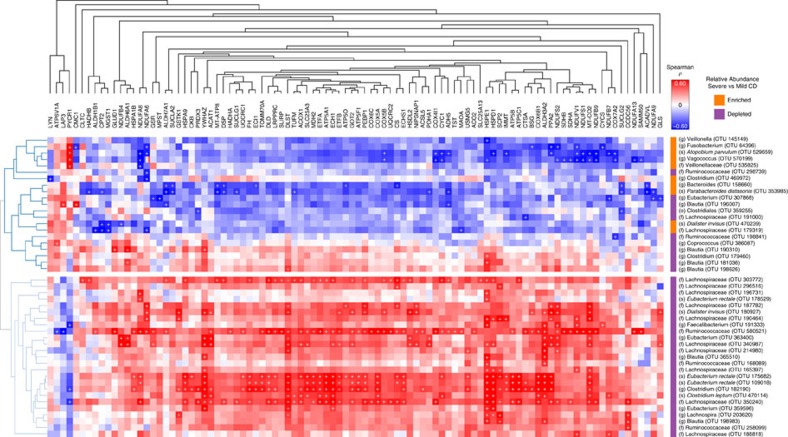
Figure 3. Microbiota–mitochondria correlation analysis.
Clustered heatmap of Spearman–Kendall correlation analysis between differentially abundant OTUs and mitochondrial proteins; red and blue colours indicate a positive or negative Spearman correlation respectively (P value <0.05 for both the Kendall Tau and the Spearman's rank statistics was used to define significance denoted by ‘+'). Note: only OTUs and mitochondrial proteins with at least one significant correlation are shown. Whether the OTU was increased or decreased in mild versus severe CD patients is denoted on the bar to the left of the OTU name (blue decreased, red increased).

