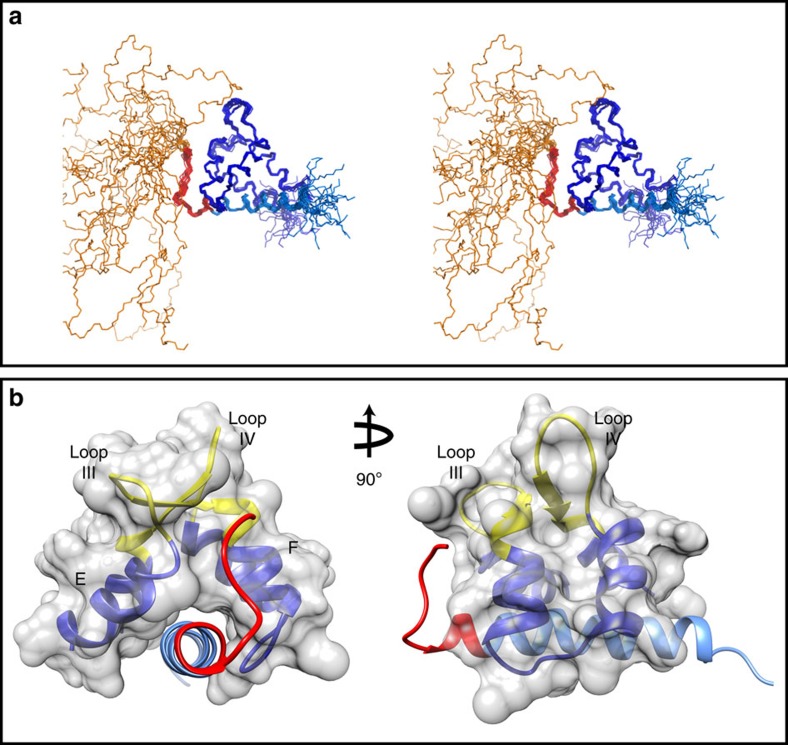
Figure 2. Three-dimensional solution structure of the PEP-19:apo C-CaM complex.
(a) An stereo representation of an overlay of all backbone atoms for the final ensemble of 20 lowest energy conformers. Apo C-CaM is shown in dark blue. The disordered N terminus (aa 1–29), acidic sequence (aa 30–40) and IQ motif (aa 41–62) are shown in gold, red and light blue, respectively. (b) Ribbon representations for the structured regions of average minimized structure excluding the disordered N-terminal region of PEP-19. The colour scheme is the same as in a. Roman numerals III and IV indicate the Ca2+ binding loops of EF-hands III and IV, respectively, which are shown in yellow. All other figures also use the averaged minimized structure for the ensemble.

