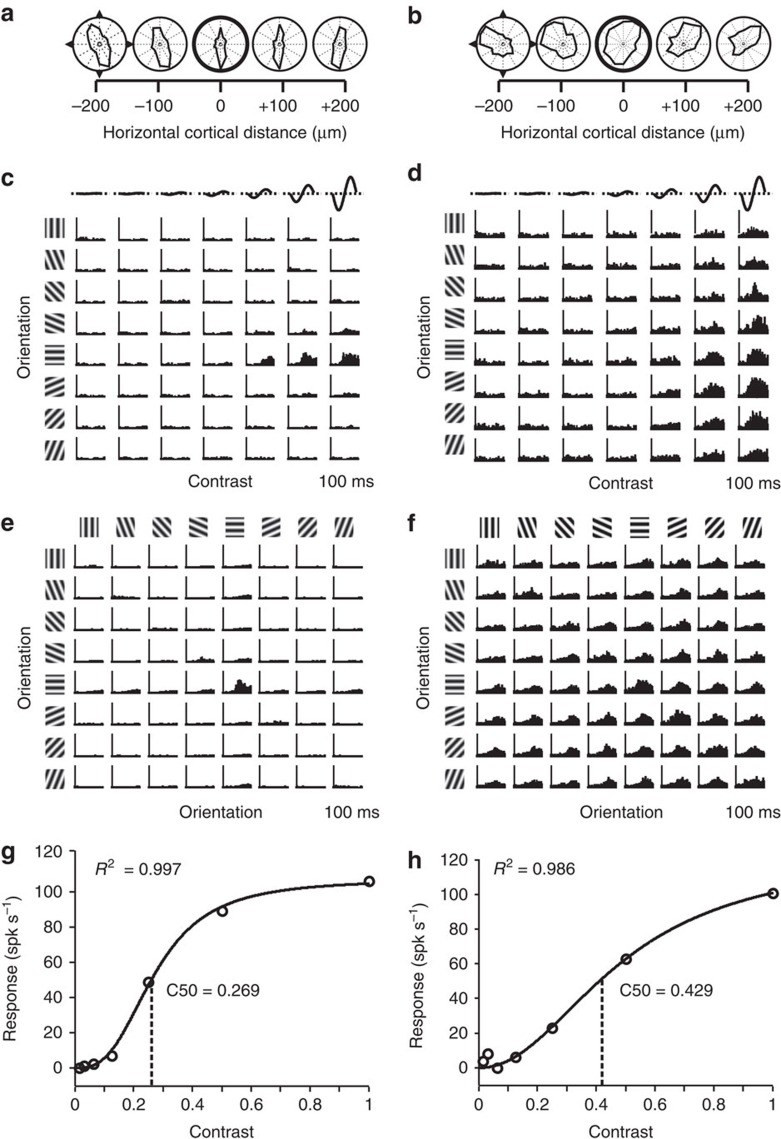
Figure 1. Responses from iso-orientation and pinwheel sites.
Recordings from two representative sites using a 32 channel probe (100 μm between recording sites) inserted tangentially into primary visual cortex. Left column: iso-orientation site. Right column: pinwheel site. (a,b) Polar plots showing the orientation preference for each of the two sites and their nearest two sites on either side, separated by 100 μm. (c) Peristimulus time histogram matrix for gratings oriented at 0°, 22.5°, 45°, 67.5°, 90°, 112.5°, 135° and 157.5° (left margin) at contrasts=1/64, 1/32, 1/16, 1/8, 1/4, 1/2 and 1.0. (top margin). This site responds primarily to horizontal orientations. (d) Peristimulus time histogram matrix for the same gratings for a broadly tuned site. (e,f) Peristimulus time histogram matrix of responses to plaids composed of gratings at 50% contrast, oriented as in the top and left margins. (g,h) Responses to increasing contrast of single gratings of preferred orientation, fit with a Naka–Rushton function. Lower semi-saturation constant (C50) corresponds to greater response compression.

