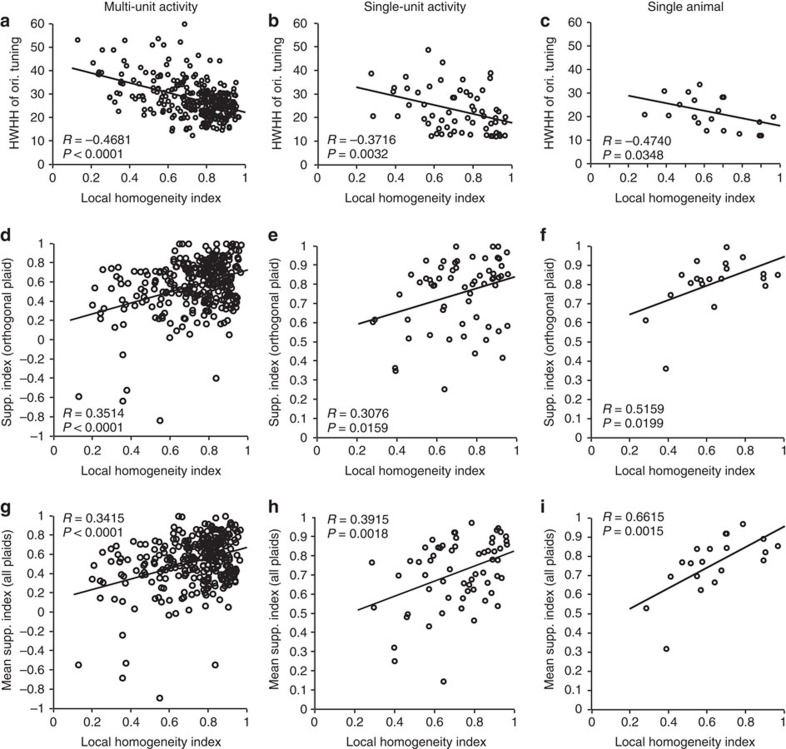
Figure 2. Association between stimulus orientation and cortical orientation topography.
Left column: multi-unit activity (N=303; 6 cats). Middle column: single neuron activity (N=61; 6 cats). Black lines depict best-fitting linear regression. Right column: single neuron activity for one cat (N=20). (a–c) Orientation tuning width versus local orientation homogeneity. (d–f) SI for the orthogonal plaid (composed of preferred grating and the orthogonal grating) as a function of local orientation homogeneity. (g–i) Mean SI (average suppression across all plaids containing the preferred orientation) as a function of the local orientation homogeneity.

