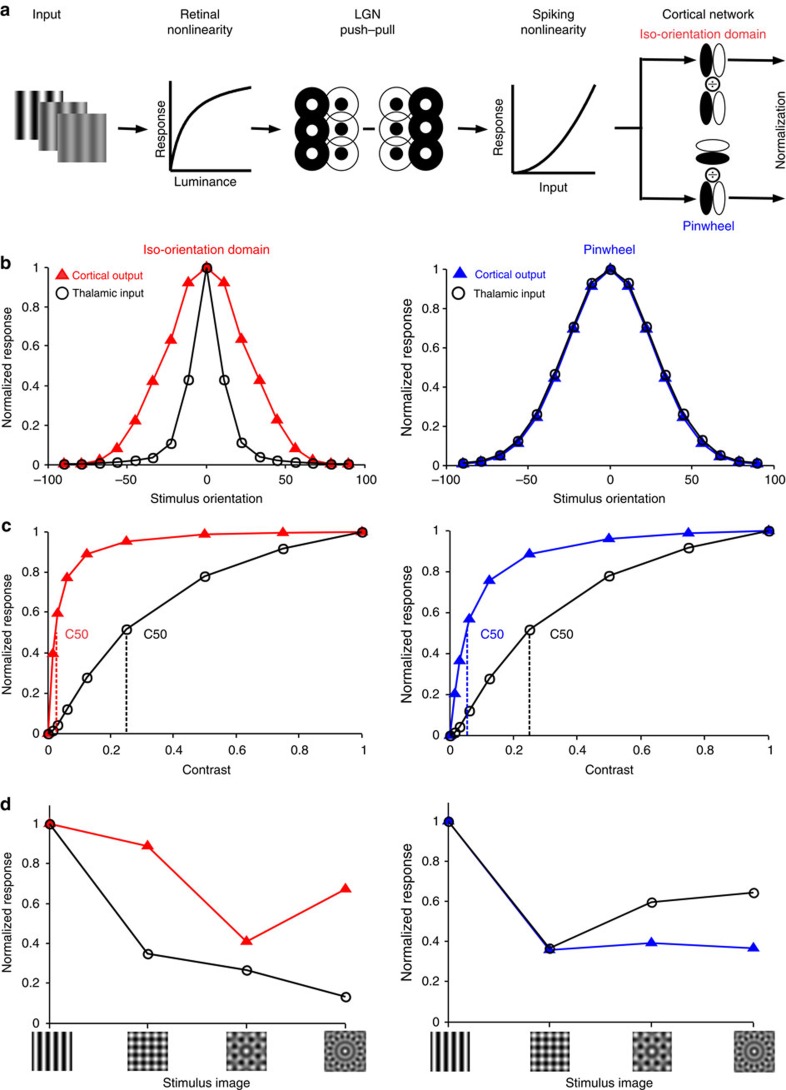
Figure 6. Cortical normalization model predictions for differences between iso-orientation domains and pinwheel centres.
(a) Model schematic: inputs were passed through a photoreceptor compressive nonlinearity. The retinal output was convolved with difference-of-Gaussian LGN receptive fields and combined in a push–pull manner to create elongated cortical receptive fields that were run through an expansive spiking nonlinearity. Neighbouring V1 neurons had orientation preferences corresponding to iso-orientation and pinwheel domains. The cortical component is normalization from surrounding oriented neurons with a factor added to the denominator, to keep it from going to zero. (b–d) Left: predictions for iso-orientation domain cortical output (red triangles) versus thalamic input for narrowly tuned neurons (black circles). Right: predictions for pinwheel domain cortical output (blue triangles) versus thalamic input for broadly tuned neurons (black circles). (b) Orientation tuning. (c) Contrast response. (d) Responses to images of increasing orientation complexity: preferred grating and plaids of 2, 4 and 8 equally spaced orientations including the preferred.

