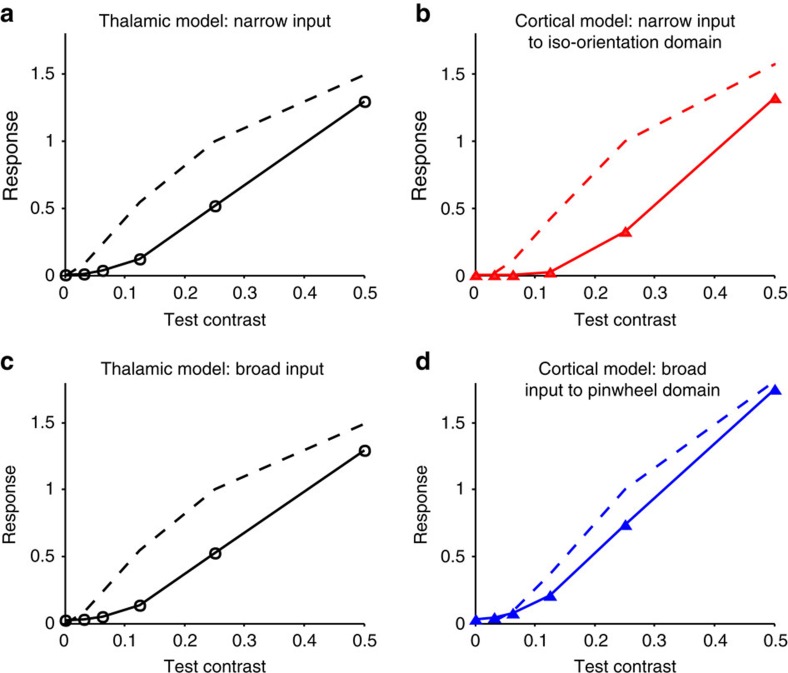
Figure 7. EN model prediction for plaids with varying component contrasts.
Predicted responses for (a) the thalamic model with narrow input to cortex, (b) the EN model with narrow input to an iso-orientation domain, (c) the thalamic model with broad input to the cortex and (d) the EN model with broad input to a pinwheel centre. Dashed curves are the contrast response curves measured through variation of the contrast of the preferred oriented single grating. Responses are normalized to the 25% contrast model output. The solid lines depict the model predictions for plaids where the preferred orientation is fixed at 25% contrast and the contrast of the component (test) orientation is varied.

