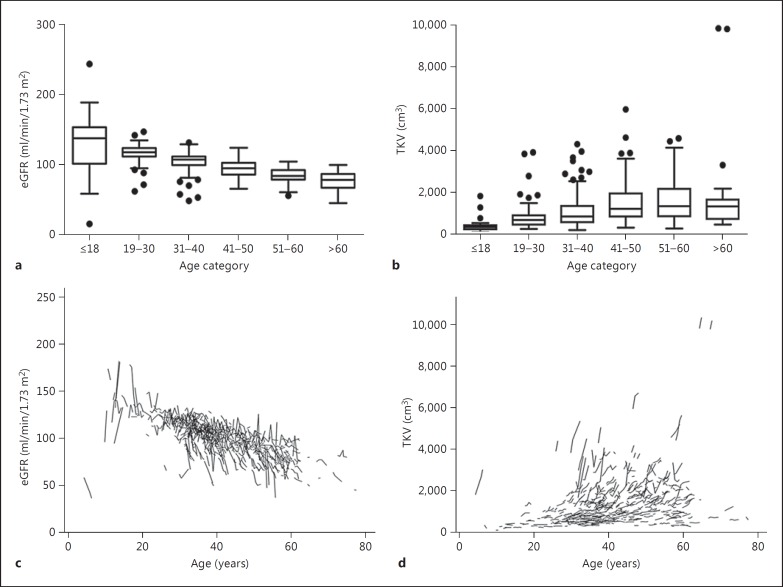
Fig. 1.
eGFR and TKV in different age categories of ADPKD patients. a EGFR for age categories ≤18 years (n = 20), 19-30 years (n = 74), 31-40 years (n = 171), 41-50 years (n = 128), 51-60 years (n = 90), and >60 years (n = 19). b TKV for age categories ≤18 years (n = 23), 19-30 years (n = 81), 31-40 years (n = 180), 41-50 years (n = 134), 51-60 years (n = 95), and >60 years (n = 19). Boxes show the median and the 25th and 75th percentile. Whiskers extend to the farthest points that are not outliers (i.e. that are within 3/2 times the interquartile range), and dots indicate outliers. Spaghetti plots for the course of eGFR (c) and TKV (d) over the entire observation time in individual patients [14].

