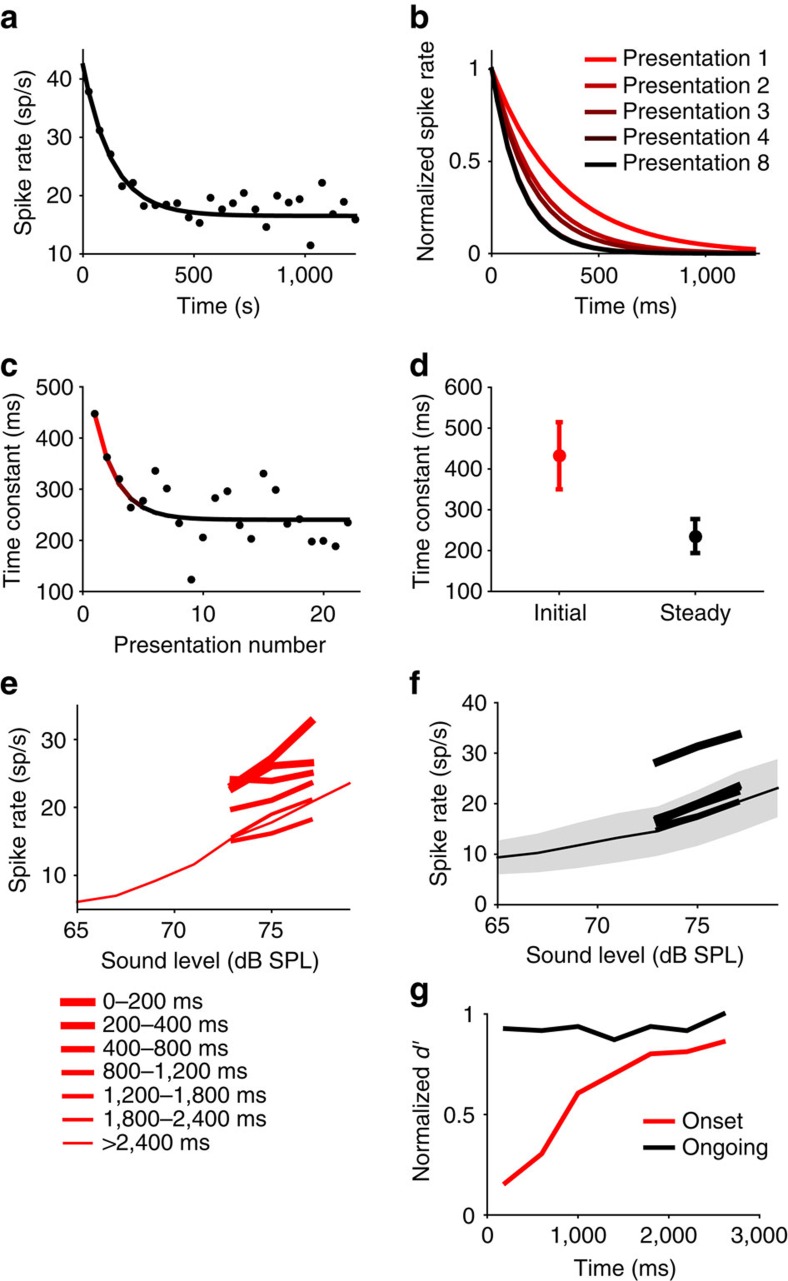
Figure 2. Meta-adaptation in the auditory midbrain.
All plots for loud environment. (a) Average firing-rate over time of a neural population of 78 IC neurons (from 14 guinea pigs), averaged over presentations 11–24. Line, exponential fit τadapt=337 ms (exponential versus flat line, P<<0.0001, f-test). (b) Exponential fits after different numbers of presentations (exponential versus flat line; P<0.05 in all 5 cases, f-test). (c) Adaptation time-constant versus presentation number. Line, exponential fit τmeta=1.9 presentations (exponential versus flat line; P=0.013, f-test). (d) Bootstrapped initial (red, median τadapt=432 ms over 10,000 bootstraps) and steady state (black, median τadapt=234 ms) adaptation time-constants, 95% confidence intervals. (e) For the same population of 78 neurons the average rate-intensity functions for the high-probability sound levels at times from environment onset, before meta-adaptation. A five-point average was used for display. (f) As e but after meta-adaptation. The grey shaded region indicates the standard deviation in the population response to a given level. (g) The neural population coding precision (d′) versus time since environment onset, before (red), after (black) meta-adaptation. All d′ normalized to the maximum of the black line.

