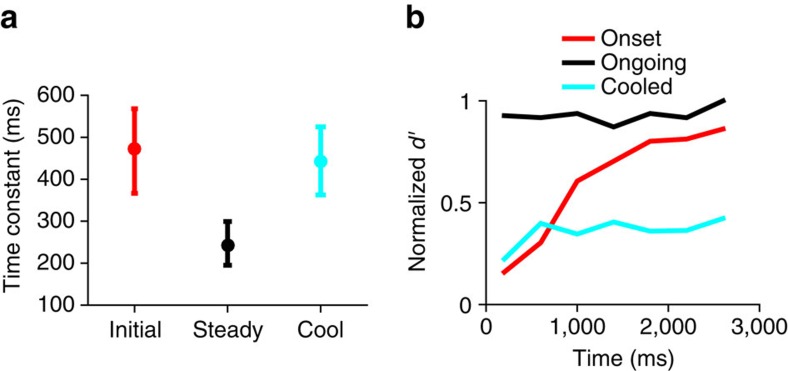
Figure 3. The effect of cooling the auditory cortex on midbrain adaptation.
All plots for loud environment. (a) For average population response of the 52 of the 78 IC neurons for which cortical cooling was performed, the bootstrapped initial (red, median τadapt=472 ms over 10,000 bootstraps) and steady state (black, median τadapt=243 ms) time-constants of adaptation before cooling, and bootstrapped time-constant of adaptation after cooling (blue, median τadapt=443 ms). (b) Neural population coding precision (d′) versus time since environment onset, before (red), and after (black) meta-adaptation, and after cooling (blue), 95% confidence intervals. The blue line is calculated from the population rate-intensity function of the same 52 neurons in a, the red and black lines used all 78 neurons. All d′ normalized to the maximum of the black line.

