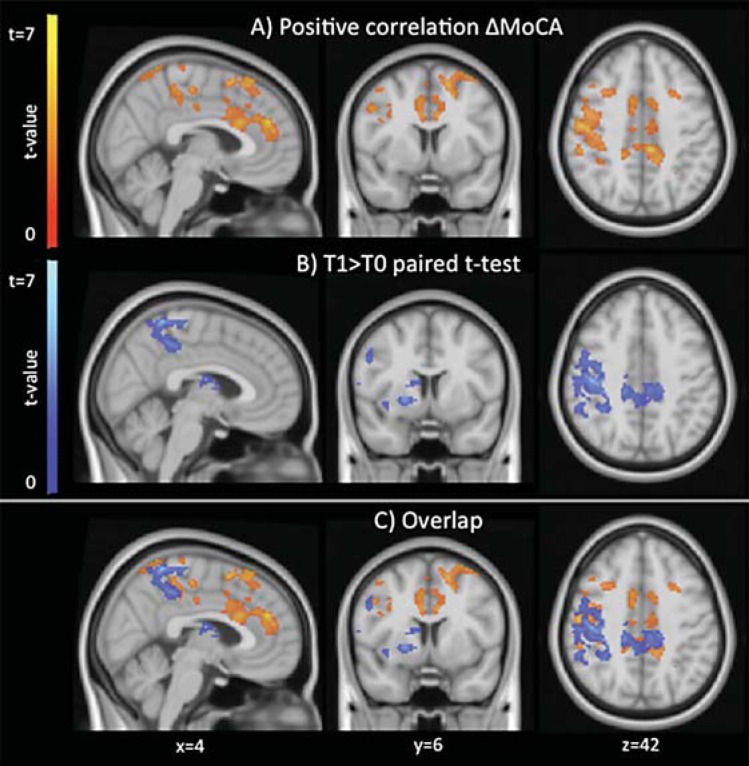
Fig. 2.
Areas showing significant positive correlation between changes in MoCA score and changes in FC (red-yellow) and those showing a significant FC increase after treatment (paired t test, blue-light blue) with the orbitofrontal RSN. Images are shown in radiological convention and MNI coordinates are reported.

