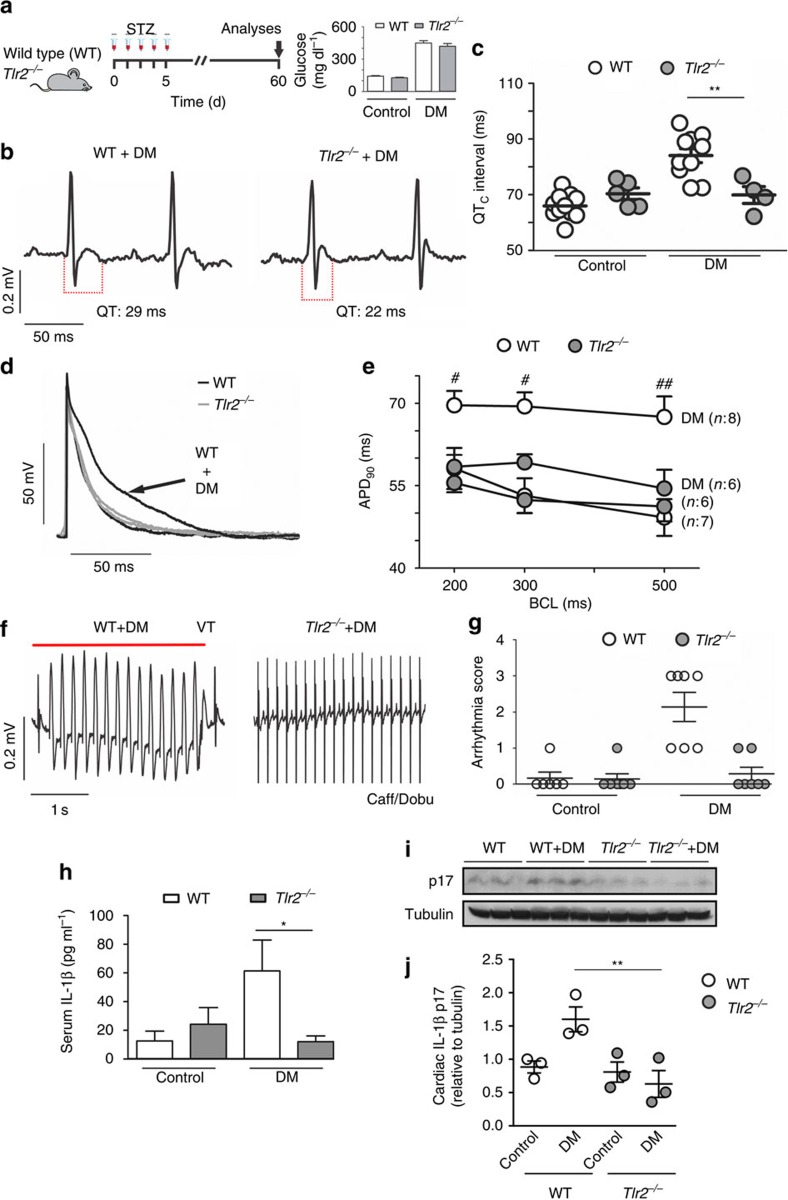
Figure 1. TLR2 regulates cardiac electrical parameters and incidence/severity of DM-induced arrhythmias.
(a) Experimental protocol: diabetes (DM) was induced in wild-type mice (WT) and toll-like receptor 2 knock-out mice (Tlr2−/−) by five daily i.p. injections of streptozotocin (STZ) (50 mg kg−1) and several parameters were analysed 60 days after the beginning of the protocol. Inset shows serum glucose levels of all experimental groups at day 60 (n=WT: 10; Tlr2−/−: 10; WT+DM: 10; Tlr2−/−+DM: 10). (b) Representative ECG traces of DM mice highlighting QT interval prolongation only in the WT group. (c) Corrected QT (QTc) interval duration (n=WT: 10; Tlr2−/−: 5; WT+DM: 10; Tlr2−/−+DM: 4). (d) Representative action potential (AP) traces from the endocardial layer of left ventricle strips at 300 ms basic cycle length (BCL) stimulation. (e) AP duration at 90 per cent of repolarization (APD90) in different BCL (n=WT: 7; Tlr2−/−: 6; WT+DM: 8; Tlr2−/−+DM: 6). (f) Representative ECG traces during arrhythmia vulnerability test induced by caffeine and dobutamine (Caff/Dobu) showing ventricular tachycardia (VT - see red line) in WT+DM mice and a normal ECG in Tlr2−/−+DM. (g) Score quantification of arrhythmia incidence and severity (n=WT: 6; Tlr2−/−: 6; WT+DM: 7; Tlr2−/−+DM: 7). (h–j) Serum and local (heart) protein levels of IL-1β after 60 days of DM induction in experimental groups. Graph represents three (serum) and two (hearts, n=6 mice per group) independent experiments performed in duplicate. The results are expressed as mean±s.e.m. Scatter plot shows values from individual mice, where horizontal bars represent means and error bars, s.e.m. * and ** represent respectively P<0.05 and P<0.01 versus WT+DM, (unpaired t-test). # and ## represent, respectively, P<0.05 and P<0.01 versus WT+DM (Bonferroni's post test following two-way ANOVA).

