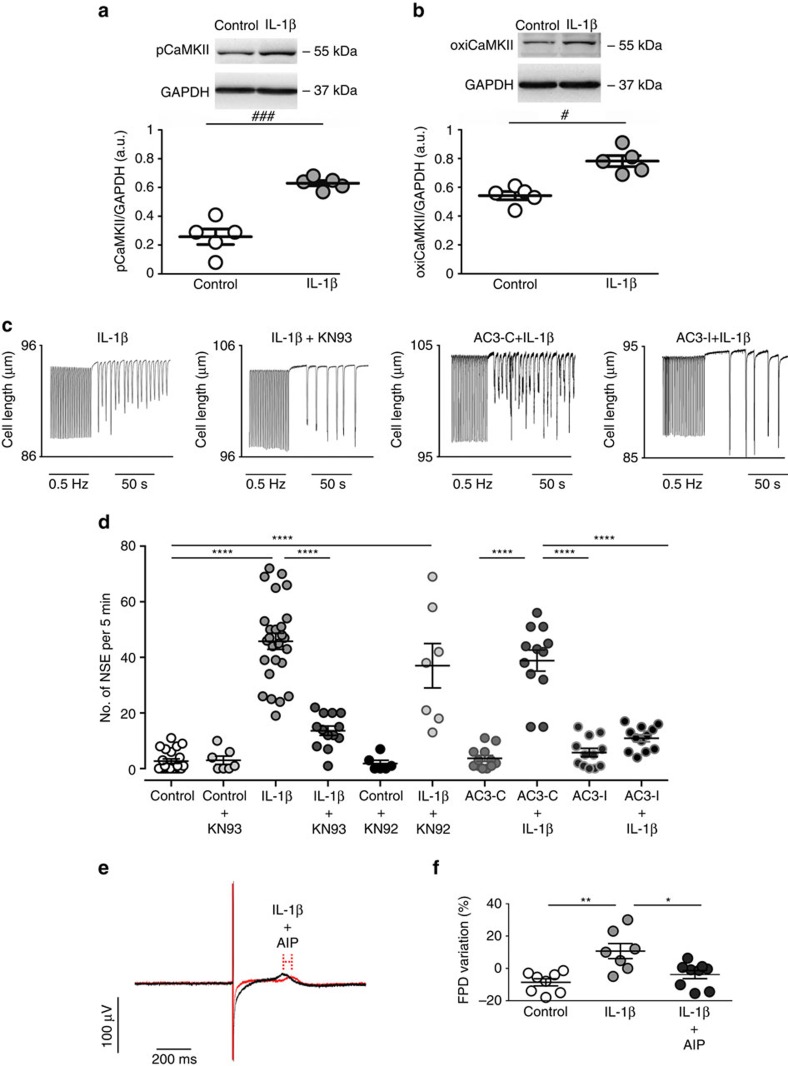
Figure 3. IL-1β induces pCaMKII/oxiCaMKII and spontaneous cardiac activity.
(a) Representative immunoblots of pCaMKII and GAPDH and quantitative densitometry values after 24 h incubation in the absence (control) or presence of IL-1β. (b) Representative immunoblots of oxiCaMKII and GAPDH and quantitative densitometry values. (c) Representative traces of cell shortening in isolated rat cardiomyocyte after 24 h incubation with IL-1β or IL-1β plus CaMKII inhibitor (KN93) as well as in transgenic mice with myocardial-delimited expression of the specific peptide inhibitor of CaMKII inactive control (AC3-C) or the active inhibitory (AC3-I), in which spontaneous contractions developed after pacing (0.5 Hz) interruption. (d) Number of spontaneous contractions for 5 min after pacing (NSE), which was increased after IL-1β incubation (n of cells=Control: 22; Control+KN93: 7; IL-1β: 26; IL-1β+KN93: 13; Control+KN92: 6; IL-1β +KN92: 7; AC3-C: 12; AC3-C+IL-1β: 12; AC3-I: 12; AC3-I+IL-1β: 12; from three hearts). (e) Representative traces of field potential in human iPS-derived cardiomyocytes highlighting inhibitory influence of CamKII with AIP of the IL-1β effect on the field potential duration (FPD). (f) FPD variation in individual cell preparations after 24 h incubation with control solution or IL-1β+AIP (10 ng ml−1 and 1 μmol l−1, respectively) (n=Control: 8; IL-1β: 7; IL-1β+AIP: 9; obtained from three independent experiments). The results are expressed as mean±s.e.m. Scatter plot shows values from individual cell preparations, where horizontal bars represent means and error bars, s.e.m. # and ### represents, respectively, P<0.05 and P<0.001 (unpaired t-test). *, ** and **** represent, respectively P<0.05, P<0.01 and P<0.0001 (Bonferroni's post test following one-way ANOVA).

