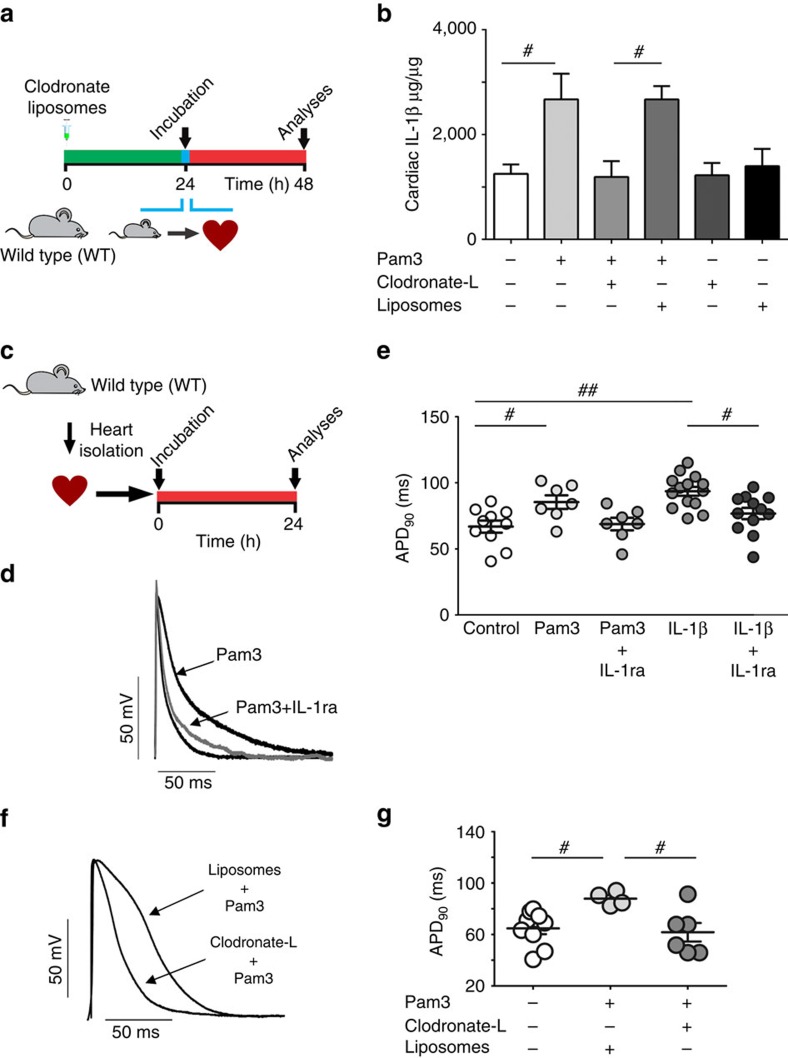
Figure 4. TLR2 regulates APD through production of IL-1β by cardiac macrophages.
(a) Experimental protocol: macrophages from rat hearts were depleted with clodronate liposomes (clodronate-L). After depletion, cardiac muscle strips were incubated with TLR2 agonist Pam3 (1 μg ml−1). Liposomes containing PBS were used as control vehicle solution (Liposomes). (b) Enzyme-linked immunosorbent assay quantification of IL-1β cardiac content (graph represents three independent experiments in duplicate, n=6 hearts per group). (c) Experimental protocol: rat cardiac muscle strips were incubated for 24 h with Pam3 (1 μg ml−1) in the presence or absence of the IL-1 receptor antagonist IL-1ra (100 ng ml−1) and electrical function was assessed (n of cells=Control: 10; Pam3: 7; Pam3+IL-1ra: 7; IL-1β: 14; IL-1β+IL-1ra: 12; from four hearts). (d) Representative action potential (AP) traces from endocardial layer of left ventricle strips at 300 ms basic cycle length (BCL). (e) The graph summarizes the APD90 values from endocardial layer of left ventricle strips at 300 ms BCL under different condition. (f,g) Representative AP traces (left panel) and APD90 values (right panel) in rats cardiac strips from animals pre-treated with clodronate liposomes or control liposomes and then exposed 24 h to Pam3 (n=Control: 10; Pam3+liposomes: four hearts ; Pam3+clodronate-L: six hearts). The results are expressed as mean±s.e.m. Scatter plots show values from individual cell preparations, where horizontal bars represent means and error bars, s.e.m. # and ## represents, respectively P<0.05 and P<0.01 (Bonferroni's post test following one-way ANOVA).

