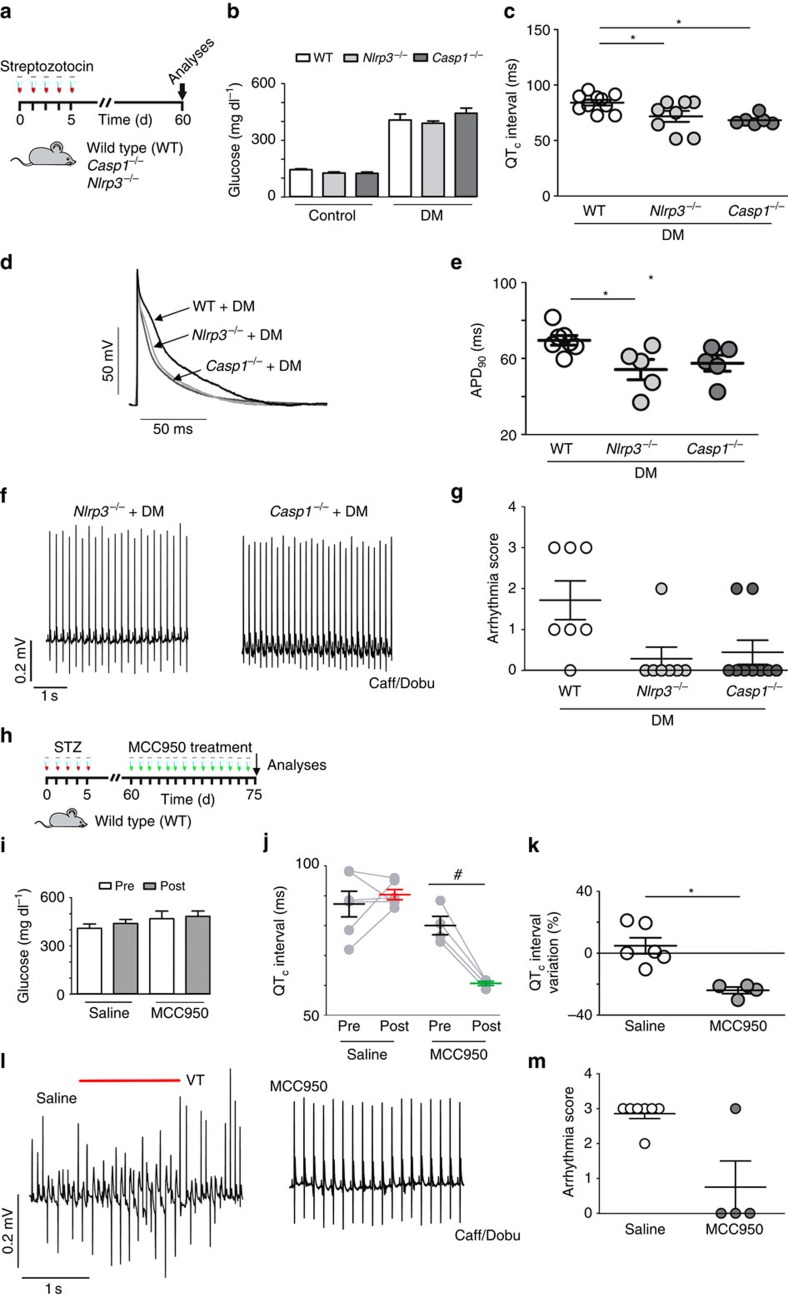
Figure 6. DM-induced cardiac electrical alterations are regulated by the NLRP3 inflammasome.
(a) Experimental protocol: diabetes induction in WT, NLRP3 knockout (Nlrp3−/−) and Casp1 knockout mice (Casp1−/−). (b) Fasting blood glucose levels at day 60 (n=WT+DM: 10; Nlrp3−/−+DM: 8; Casp1−/−+DM: 10). (c) Corrected QT (QTc) interval duration (n=WT+DM: 10; Nlrp3−/−+DM: 8; Casp1−/−+DM: 6). (d,e) Representative action potential (AP) traces (left panel) and APD90 data (right panel) from the endocardial layer of left ventricle strips at 300 ms basic cycle length (BCL) stimulation (n=WT+DM: 7; Nlrp3−/−+DM: 5; Casp1−/−+DM: 5). (f) Representative traces of arrhythmic vulnerability test induced by Caff/Dobu showing normal ECGs in Nlrp3−/−+DM and Casp1−/−+DM mice (n=WT+DM: 7; Nlrp3−/−+DM: 7; Casp1−/−+DM: 9). (g) Score quantification of arrhythmia incidence and severity in diabetic groups. (h) Experimental protocol for MCC-950 treatment (50 mg kg−1 i.p./daily/15 consecutive days). (i) Fasting blood glucose levels pre (day 60) and post (day 75) treatment from at least four mice per group. (j,k) QTc interval values and per cent variation pre (60 days) and post (75 days) treatment with saline or MCC-950. (l) Caff/Dobu test showing ventricular tachycardia (VT - see red line) in WT+DM treated with saline, but not when treated with MCC-950. (m) Arrhythmia score summary after MCC-950 treatment (n=Saline: 6; MCC-950: 4). The results are expressed as mean±s.e.m. Scatter plot shows values from individual mice, where horizontal bars represent means and error bars, s.e.m. * Represents P<0.05 versus WT+DM (unpaired t-test). # represent P<0.05 (Bonferroni's post test following two-way ANOVA.

