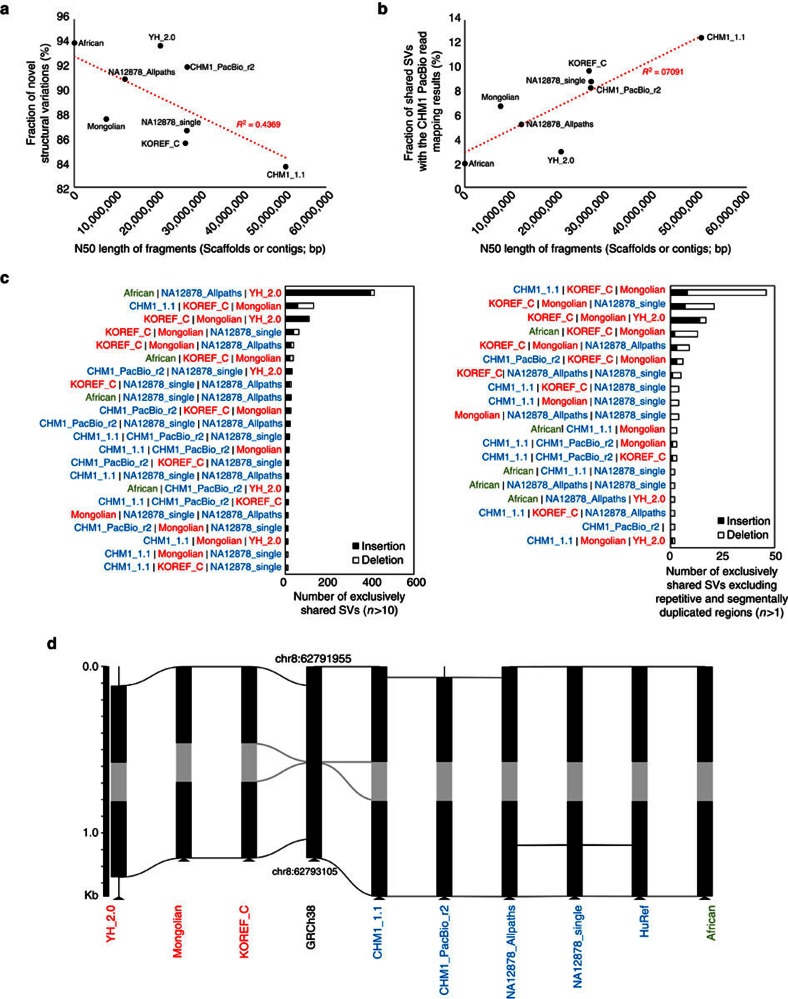
Figure 2. SVs among human assemblies.
(a) The correlation between N50 length of fragments (scaffolds or contigs) and fraction of novel SVs. (b) The correlation between N50 length of fragments and fraction of SVs shared with the CHM1 PacBio read mapping method. (c) Exclusively shared SVs among human assembly sets. SVs shared (reciprocally 50% covered) by only denoted assemblies were considered in this figure. (d) An example of SV that was shared by nine human assemblies. Grey regions denote structural differences shared among all the assemblies, and horizontal lines indicate homologous sequence regions.

