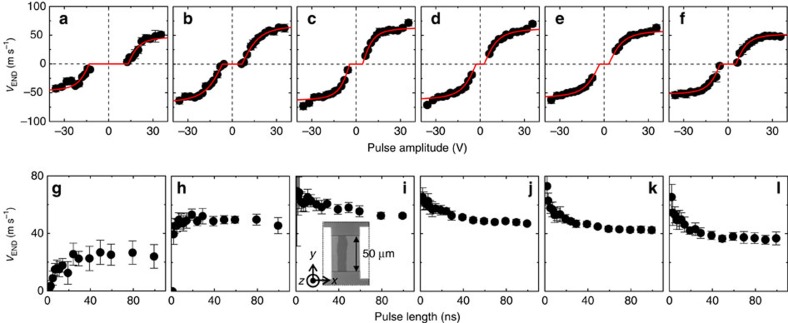
Figure 1. Pulse amplitude and pulse length-dependent domain wall (DW) velocity.
(a–f) Quasi-static DW velocity vEND plotted against pulse amplitude for a fixed pulse length (tP=10 ns). The red solid line represents fitting with the 1D model (equation (1)). (g–l) Pulse length dependence of vEND for fixed pulse amplitude (±16 V). Symbols represent the average |vEND| for both positive (16 V) and negative (−16 V) pulse amplitudes. The W layer thickness d varies for a–f and g–l as 2.3, 2.6, 3.0, 3.3, 3.6, 4.0 nm. Inset of i: representative optical (Kerr) microscopy image of the device and the definition of the coordinate axis. All results are from film set A, wire width is ∼50 μm. The error bars represent standard deviation of the velocity estimated in three sections of the wire (see Methods for the definition of the sections).

