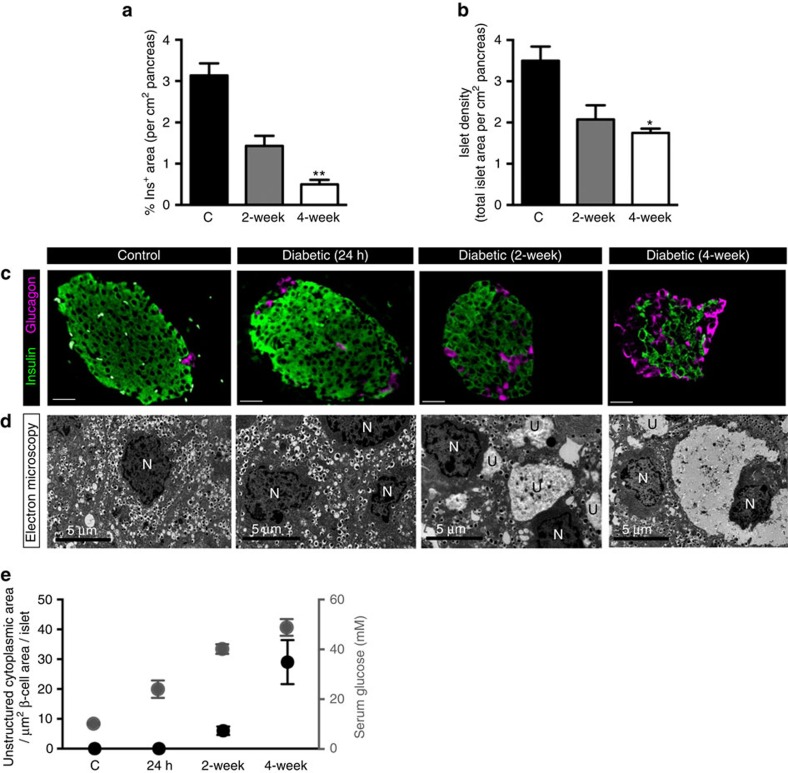
Figure 1. Hyperglycaemia in βV59M mice induces progressive changes in β-cell mass and ultrastructure.
(a,b) Mean islet cross-sectional area immunostaining for insulin (a), and total islet area (b), expressed as a percentage of the total cross-sectional area of the pancreas (cm2) in control mice (black bar; n=8), and βV59M mice left diabetic for 2 weeks (gray bar; n=5) or 4 weeks (white bar; n=4). Data are mean±s.e.m. (5 sections per mouse, 100 μm apart). *P<0.05; compared with control; one-way ANOVA followed by post hoc Bonferroni test. (c,d) Representative pancreatic sections from control mice (column 1), βV59M mice left diabetic for 24 h (column 2), 2 weeks (column 3) and 4 weeks (column 4). (c) Islets were immunostained for insulin (green) and glucagon (pink). Scale bars 200 μm. (d) Electron microscopy. N, nucleus. U, unstructured substance. Scale bars 5 μm. Data are representative of 3-4 mice in each case. (e) Serum glucose measurements (white circles) and area of unstructured cytoplasm in β-cells (black circles, calculated from electron micrographs) in control, 24-h, 2-week and 4-week diabetic βV59M mice. For serum glucose measurements ‘n' corresponds to number of mice where, n=26 (control), n=6 (24-h diabetic), n=6 (2-week diabetic) and n=8 (4-week diabetic). For calculation of unstructured cytoplasm ‘n' corresponds to the number of islets from 3–8 mice where, n=8 (control), n=3 (24-h diabetic), n=4 (2-week diabetic) and n=4 (4-week diabetic). Data are mean±s.e.m.

