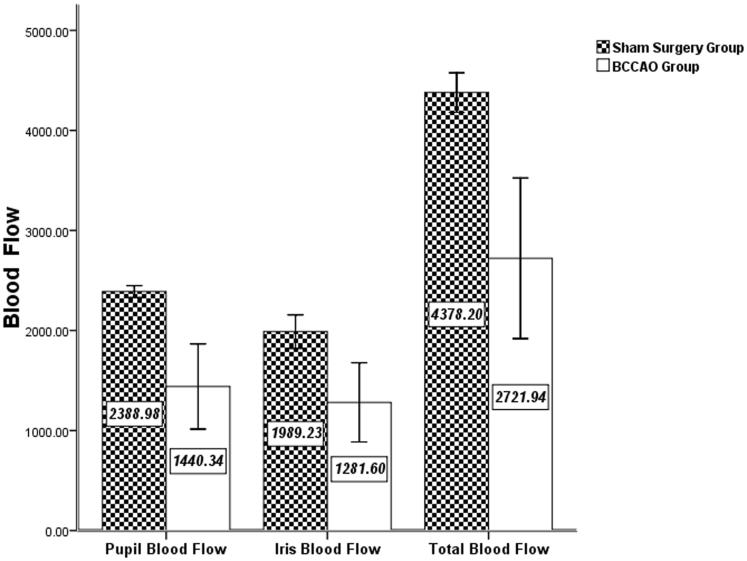
FIGURE 6.
Comparison of ocular blood flow between sham surgery and BCCAO groups. Data are expressed in PU; n = 4 in sham and n = 22 in BCCAO groups. The total blood flow of the sham surgery group was significantly greater than that of the BCCAO group (p = 0.038). The pupil area blood flow of the sham surgery group was significantly greater than that of the BCCAO group (p = 0.032). The iris area blood flow of the sham surgery group was greater than that of the BCCAO group, but the difference was not statistically significant (p = 0.091).

