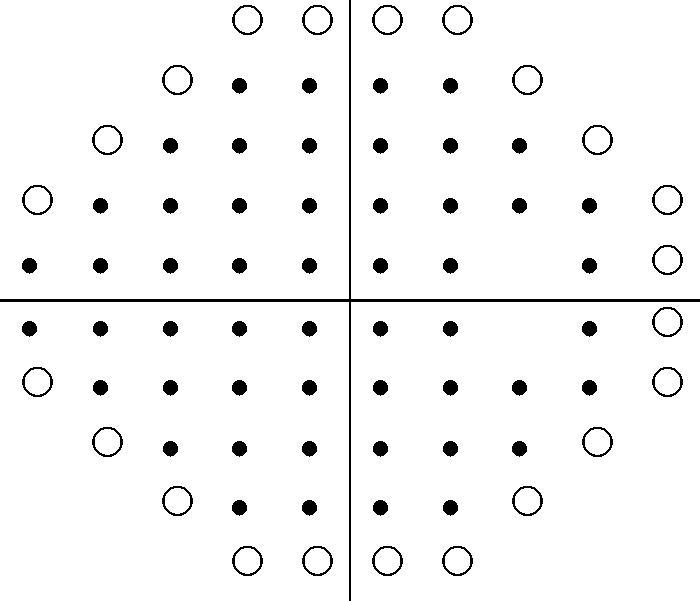
FIGURE 1.

30-2 minus 24-2 peripheral points. This is an example for the right eye showing the stimulus locations points for the 30-2 and 24-2 threshold programmes. • indicates points seen on both 30-2 and 24-2 programmes. ○ indicates points seen only on the 30-2 programme but omitted from testing on the 24-2 programme.
