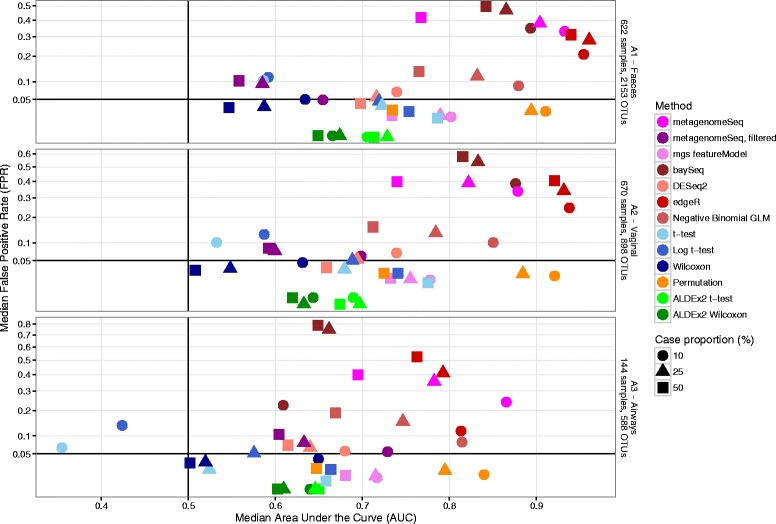
Fig. 3.

Median test AUC vs median test FPR. Scatterplots of median test area under the curve (AUC) vs median test false positive rate (FPR), for the datasets A1–A3; three different compartments in the COPSAC2010 cohort. FPR is defined as the fraction of OTUs with p < 0.05. Dot color represents differential relative abundance test method, while dot shape represents experiment case/control balance
